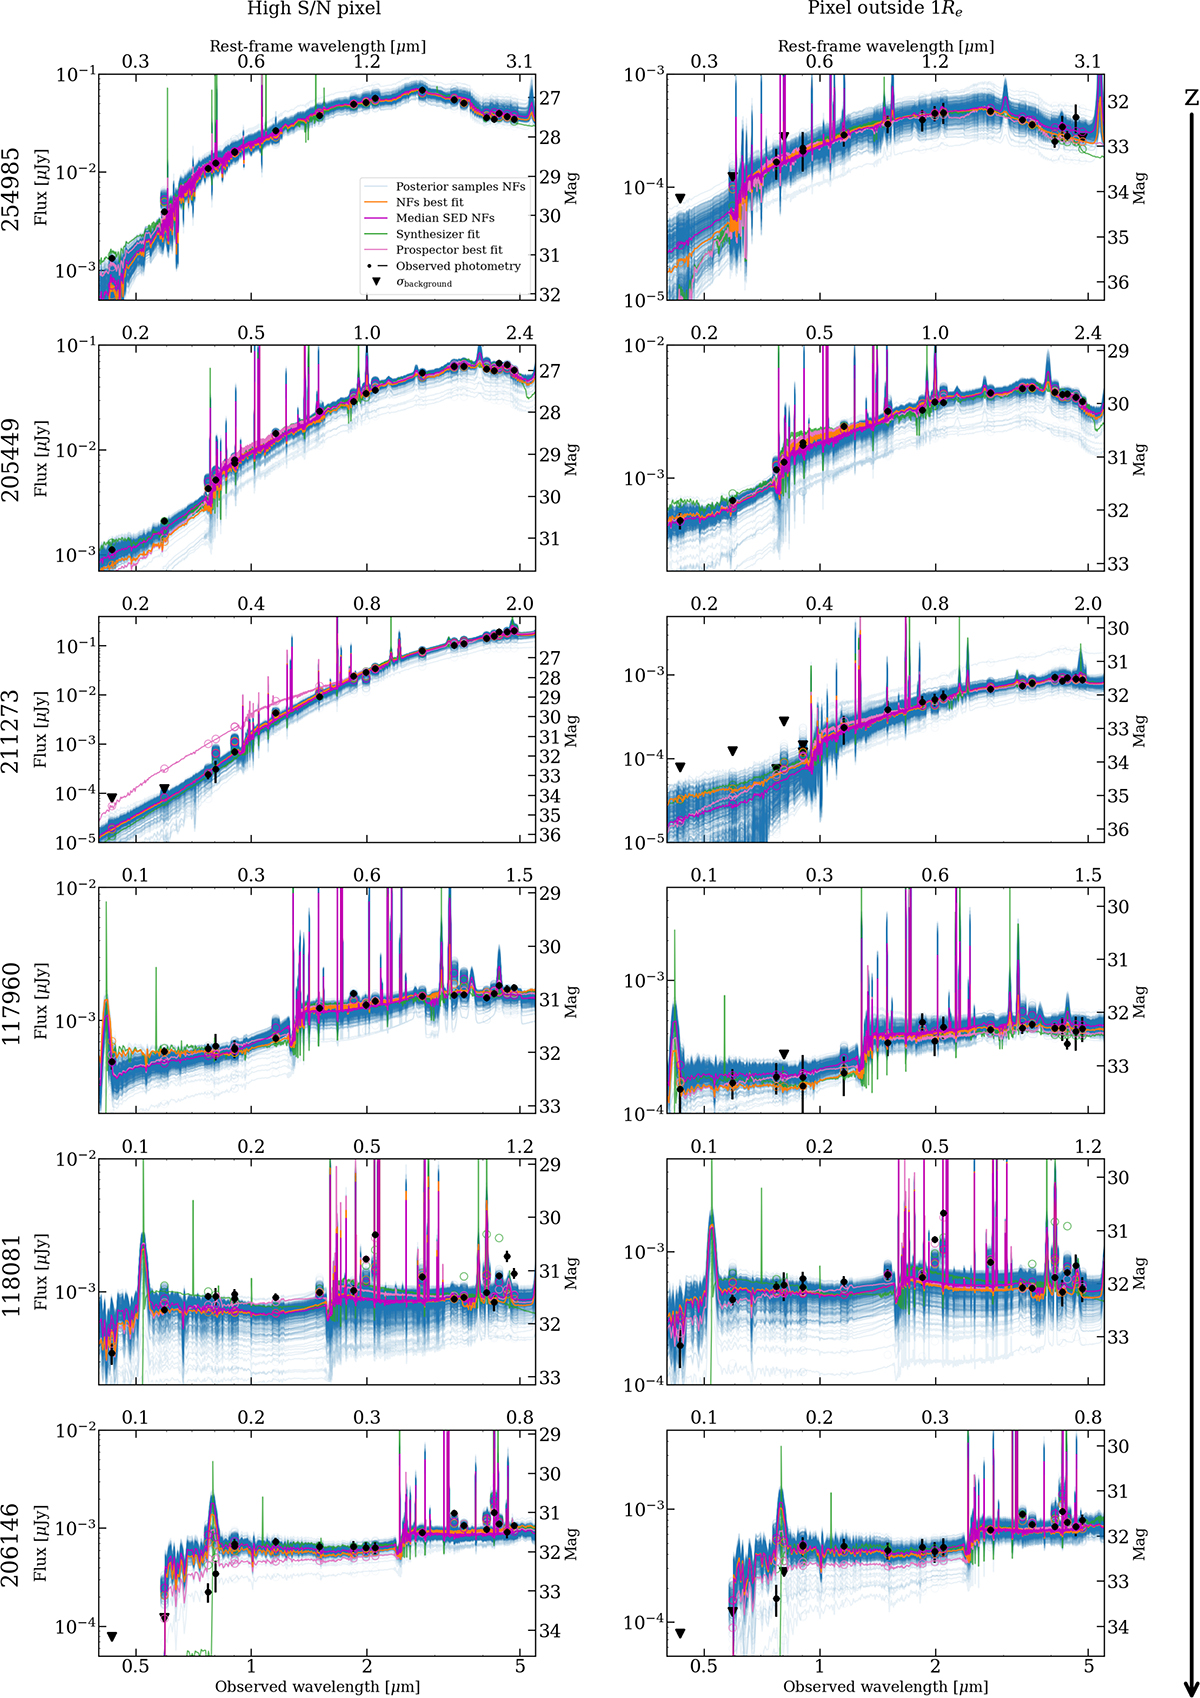
Fig. E.1.
Download original image
Fit for the two pixels of the six galaxies, repeating the simulation with 500 samples of the posterior distributions for the pixels with maximum average S/N of the galaxy. In black, we include the photometry with its error, in blue the templates fitted for each posterior sample, with blue circles for the corresponding photometry, in purple the median of these templates, and in orange the best-fit sample. We also include black triangles with the 1σ upper limits. The best fit of Prospector is shown in pink and the fit done with Synthesizer is shown in green.
Current usage metrics show cumulative count of Article Views (full-text article views including HTML views, PDF and ePub downloads, according to the available data) and Abstracts Views on Vision4Press platform.
Data correspond to usage on the plateform after 2015. The current usage metrics is available 48-96 hours after online publication and is updated daily on week days.
Initial download of the metrics may take a while.