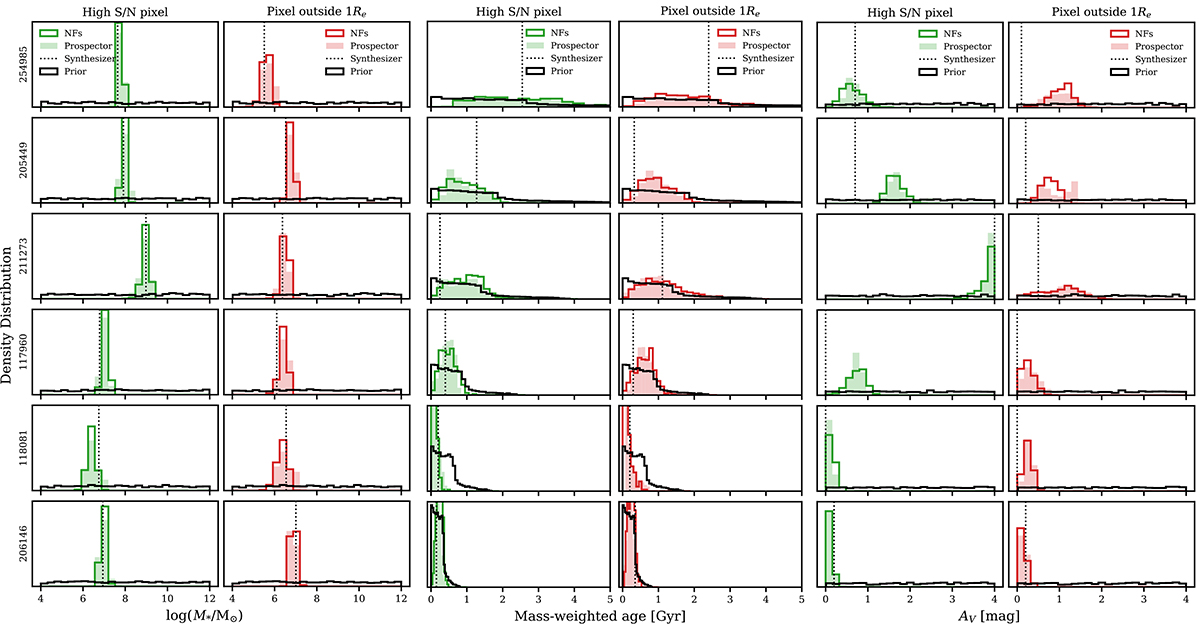
Fig. 4.
Download original image
Probability distributions for log10(M*/M⊙), the mass-weighted age [Gyr], and AV [mag] for the pixel with highest mean S/N in the filters F277W, F356W, and F444W (in green), and a random pixel out of 1 Reff (in red) for the six galaxies. Step histograms (solid lines) represent the prior distributions (in black) and our posterior distributions (in green and red). The posterior distributions from Prospector are shown with lower opacity (in green and red). The dotted lines correspond to the minimum χ2 parameters obtained with the optimisation code Synthesizer.
Current usage metrics show cumulative count of Article Views (full-text article views including HTML views, PDF and ePub downloads, according to the available data) and Abstracts Views on Vision4Press platform.
Data correspond to usage on the plateform after 2015. The current usage metrics is available 48-96 hours after online publication and is updated daily on week days.
Initial download of the metrics may take a while.