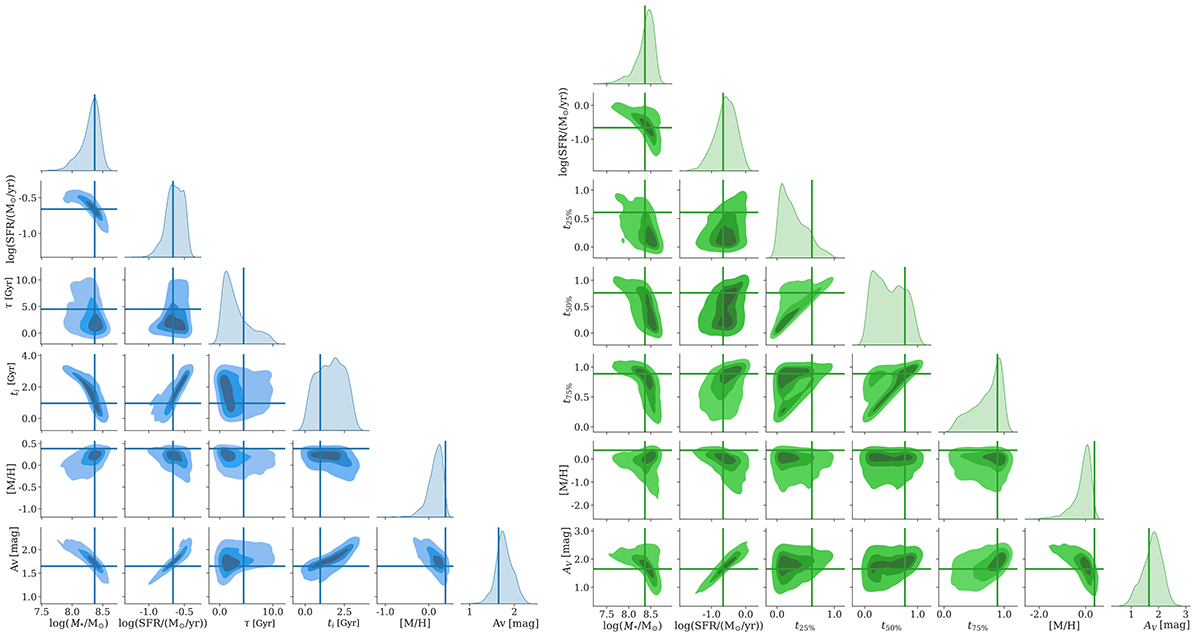
Fig. A.1.
Download original image
Corner plots showing the posterior distributions for a simulated galaxy (using a τ-delayed SFH) at redshift 1.89, obtained with the τ-delayed model (left) and Dirichlet model (right). Each posterior uses 500 samples. Kernel density estimation contours are shown with different shades at iso-proportions of the density of samples. The solid lines correspond to the true values.
Current usage metrics show cumulative count of Article Views (full-text article views including HTML views, PDF and ePub downloads, according to the available data) and Abstracts Views on Vision4Press platform.
Data correspond to usage on the plateform after 2015. The current usage metrics is available 48-96 hours after online publication and is updated daily on week days.
Initial download of the metrics may take a while.