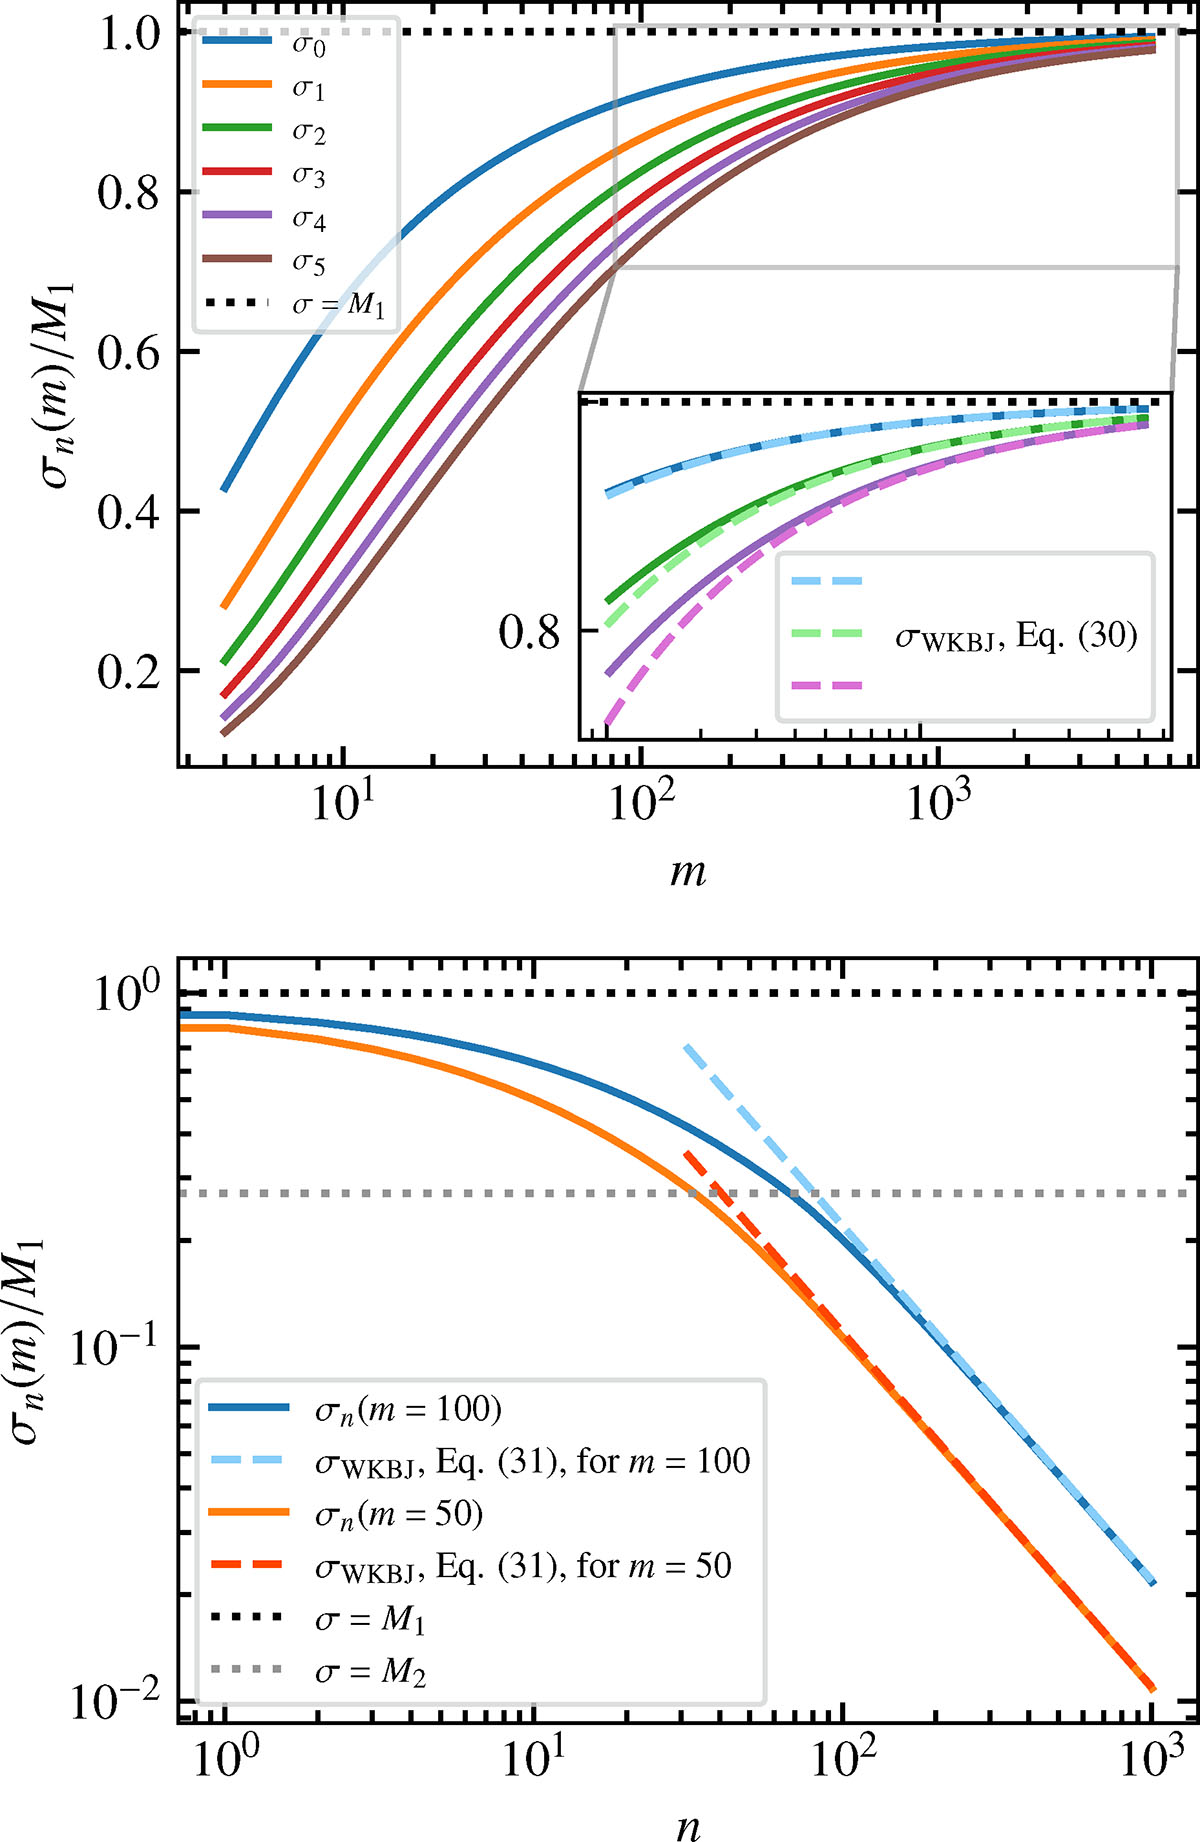
Fig. 4.
Download original image
Dispersion relations of the global MTI eigenmodes. Top: growth rates of the first six MTI modes as a function of the azimuthal order, m. The curve σ = M1 is indicated in dotted dark line. It seems to be a common asymptote to all curves, σn(m). Inset: same growth rates, σn, again (one over two for the sake of visibility though), together with their WKBJ approximations, Eq. (30), in dashed lines. Bottom: growth rates of the MTI eigenmodes with m = 100 and m = 50 as a function of the mode number, n, in plain lines. Their WKBJ approximations, Eq. (31), are shown too, in dashed lines. The curve σ = M2 is indicated in dotted grey line.
Current usage metrics show cumulative count of Article Views (full-text article views including HTML views, PDF and ePub downloads, according to the available data) and Abstracts Views on Vision4Press platform.
Data correspond to usage on the plateform after 2015. The current usage metrics is available 48-96 hours after online publication and is updated daily on week days.
Initial download of the metrics may take a while.