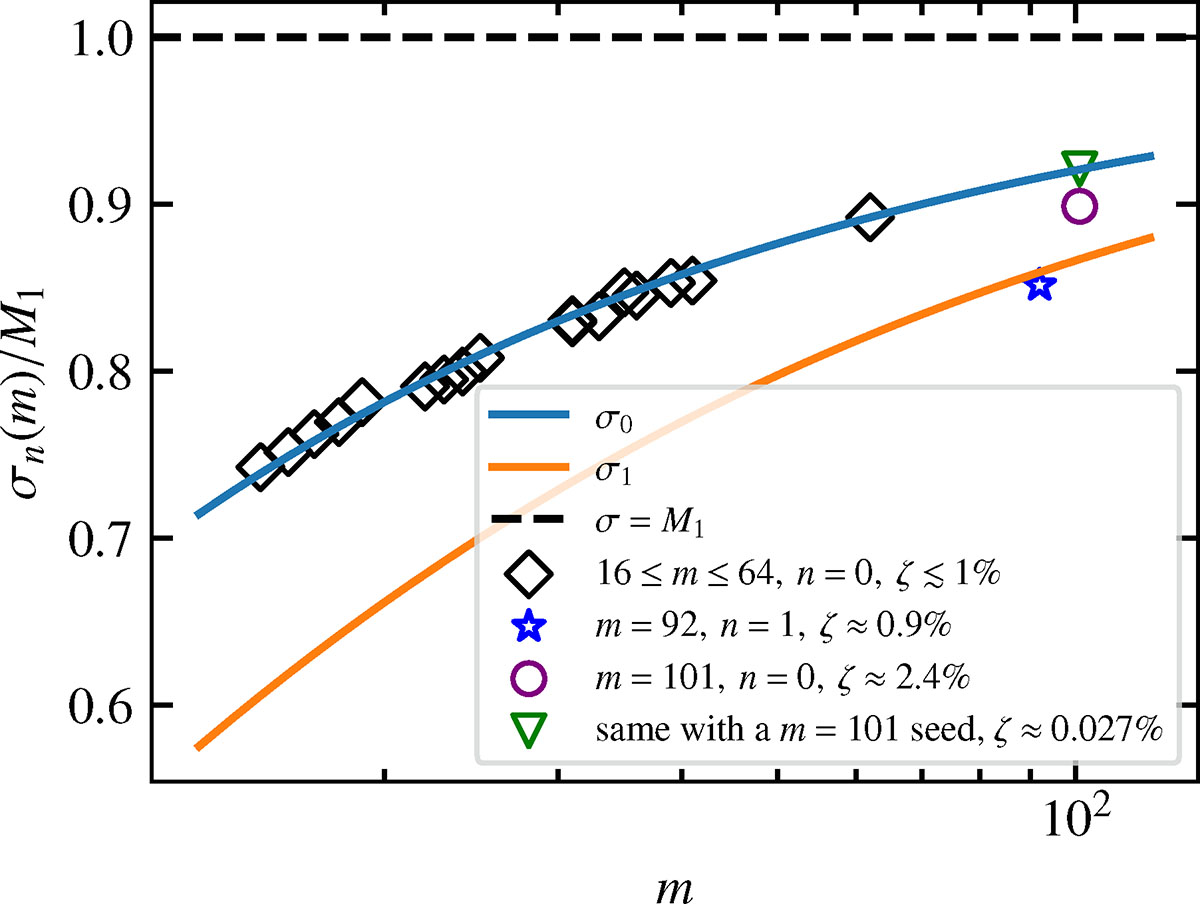
Fig. 5.
Download original image
Comparison between the analytical dispersion relation (in plain lines) and the numerically measured growth rates (markers). Black diamonds are the numerical growth rates of the most unstable modes with n = 0, found in the first simulation seeded with low amplitude random white noise on the velocity field. They match the theoretical dispersion relation to within ζ ≲ 1%. The blue star depicts the MTI eigenmode with m = 92 and n = 1, which could be successfully isolated in the same simulation. The purple circle stands for the numerical growth rate of the MTI eigenmode with m = 101 and n = 0. It agrees with the theoretical dispersion relation to within ζ ≈ 2.0% only. The green triangle represents the numerical growth rate of the exact same mode, but in a simulation seeded with a single mode. The error is very small, ζ ≈ 0.027%.
Current usage metrics show cumulative count of Article Views (full-text article views including HTML views, PDF and ePub downloads, according to the available data) and Abstracts Views on Vision4Press platform.
Data correspond to usage on the plateform after 2015. The current usage metrics is available 48-96 hours after online publication and is updated daily on week days.
Initial download of the metrics may take a while.