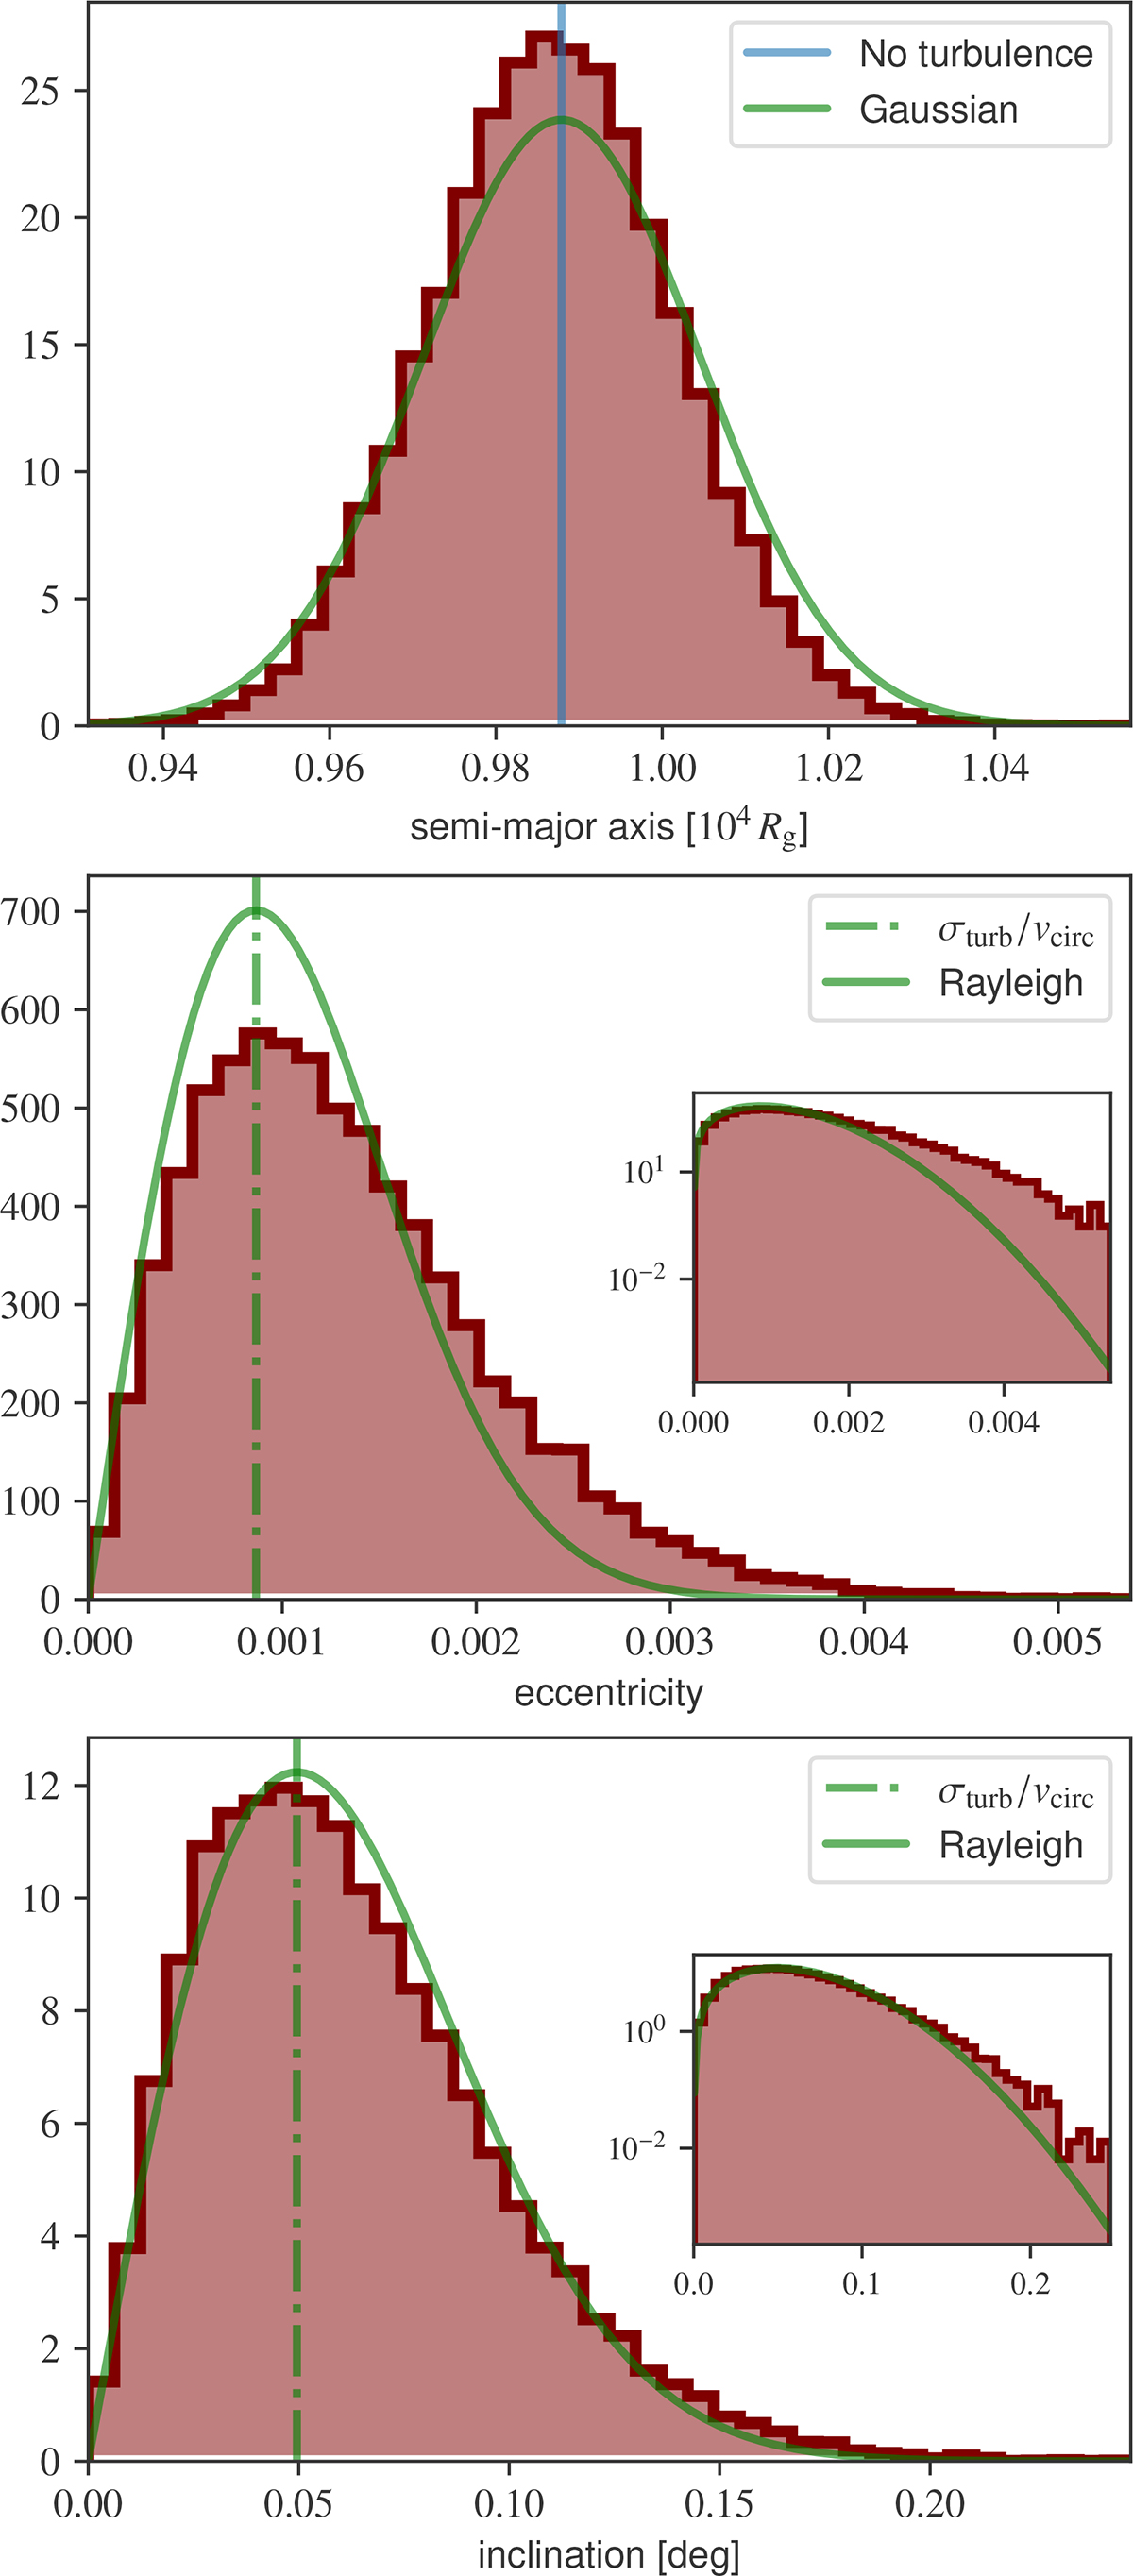
Fig. 4.
Download original image
Distributions (normalized to one) of the semimajor axis (top), the eccentricity (middle) and the inclination (bottom) for 2.5 × 10⁴ realizations of an embedded BH, evaluated after 20 initial orbital periods. The initial conditions are identical to those in Fig. 3. In the top panel, the blue line marks the final semimajor axis from the nonturbulent simulation, while the green curve shows a Gaussian distribution with standard deviation given by Eq. (44). In the middle and bottom panels, the dot-dashed green line is the ratio between the turbulent velocity dispersion σturb and the circular velocity vcirc, while the green curves indicate Rayleigh distributions with mean value σturb/vcirc. The insets show the same distributions in logarithm scale, highlighting the presence of fatter tails with respect to the Rayleigh prediction.
Current usage metrics show cumulative count of Article Views (full-text article views including HTML views, PDF and ePub downloads, according to the available data) and Abstracts Views on Vision4Press platform.
Data correspond to usage on the plateform after 2015. The current usage metrics is available 48-96 hours after online publication and is updated daily on week days.
Initial download of the metrics may take a while.