Fig. 1
Download original image
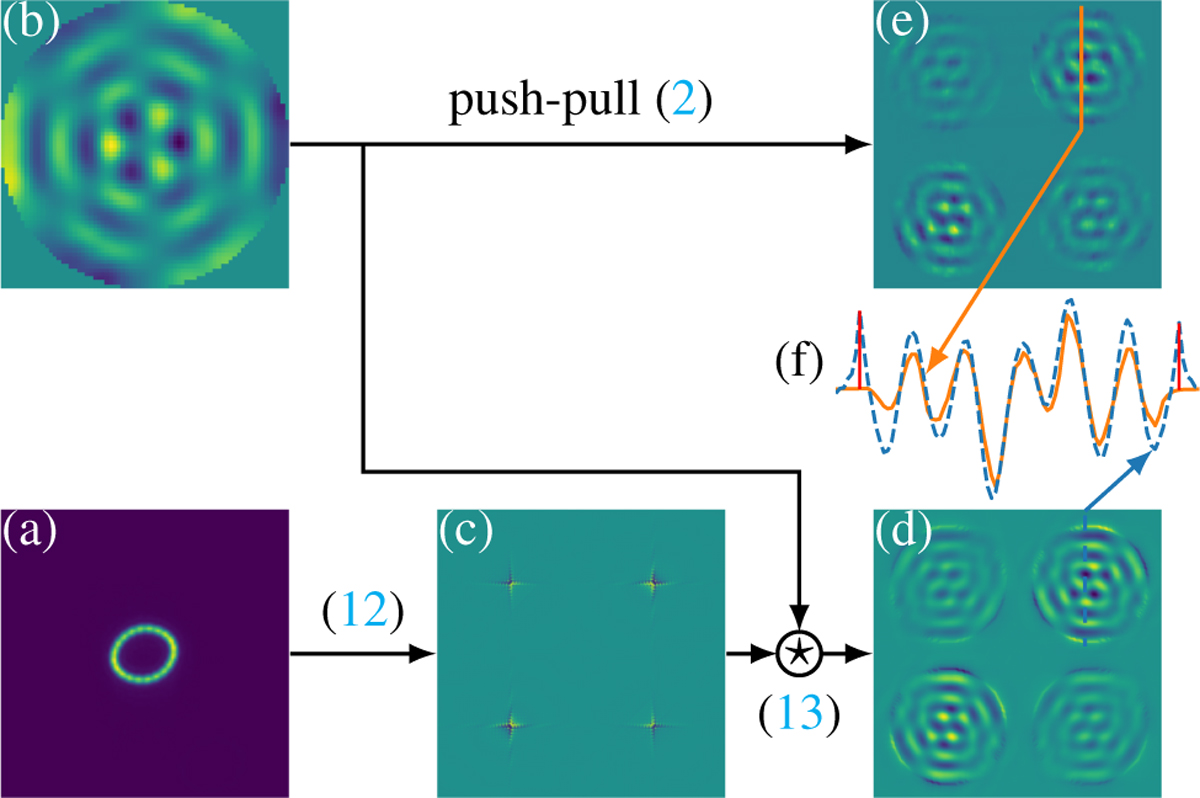
(a) Experimental focal-plane camera frame; (b) KL mode 80; (c) impulse response, in symmetrical logarithmic scale for visualisation purpose; (d) reconstructed PFWS response using the convolutional model; (e) experimental linear response, obtained through push-pull process; (f) 1D profile of one sub-pupil of experimental and simulated PWFS signal, with red lines indicating the edge effects due to the convolutional model.
Current usage metrics show cumulative count of Article Views (full-text article views including HTML views, PDF and ePub downloads, according to the available data) and Abstracts Views on Vision4Press platform.
Data correspond to usage on the plateform after 2015. The current usage metrics is available 48-96 hours after online publication and is updated daily on week days.
Initial download of the metrics may take a while.