Open Access
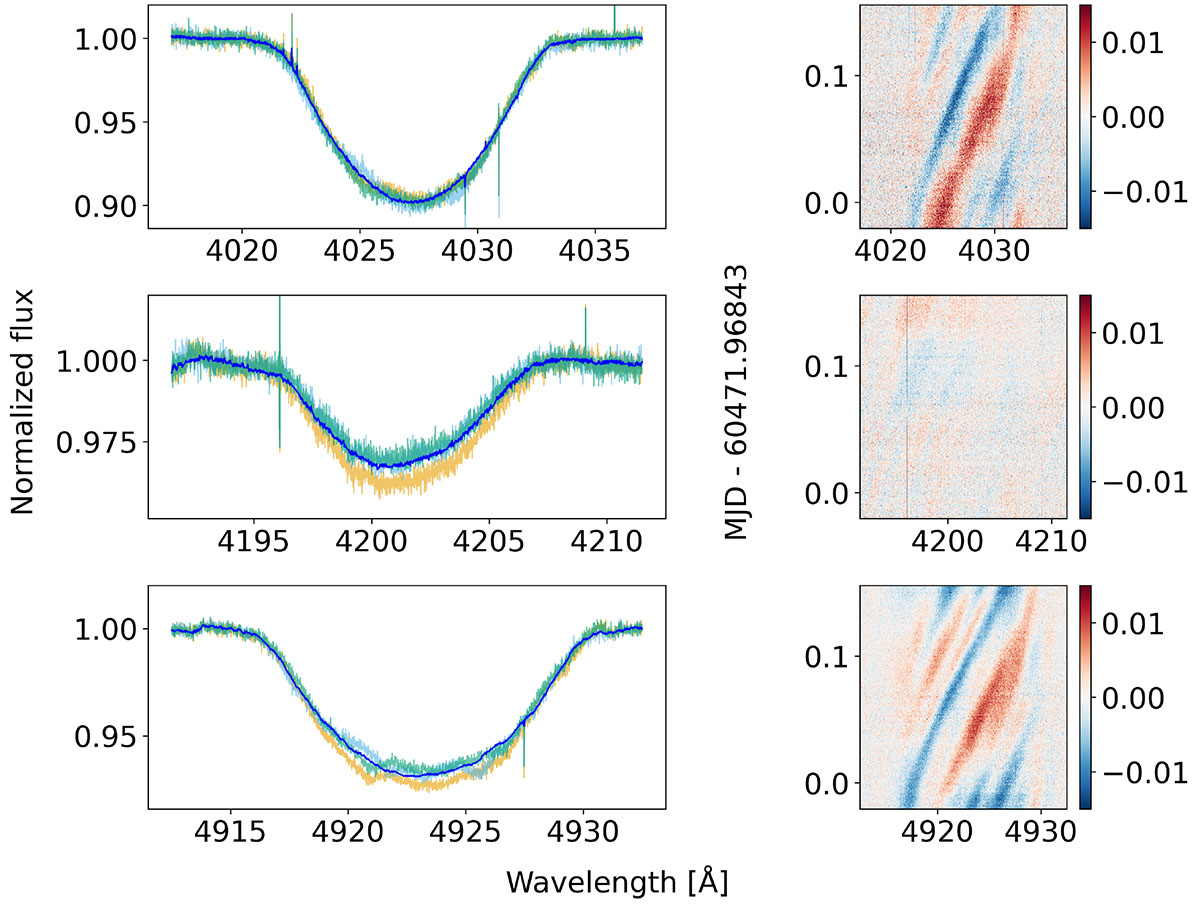
Fig. 1.
Download original image
Left panels: three spectra from 9 June 2024 showing LPV for the He I+IIλ4026, He IIλ4200, and He Iλ4922 lines (from top to bottom), with the stacked mean spectrum overplotted in dark blue. Right panels: residual dynamic spectra for the corresponding left panels.
Current usage metrics show cumulative count of Article Views (full-text article views including HTML views, PDF and ePub downloads, according to the available data) and Abstracts Views on Vision4Press platform.
Data correspond to usage on the plateform after 2015. The current usage metrics is available 48-96 hours after online publication and is updated daily on week days.
Initial download of the metrics may take a while.