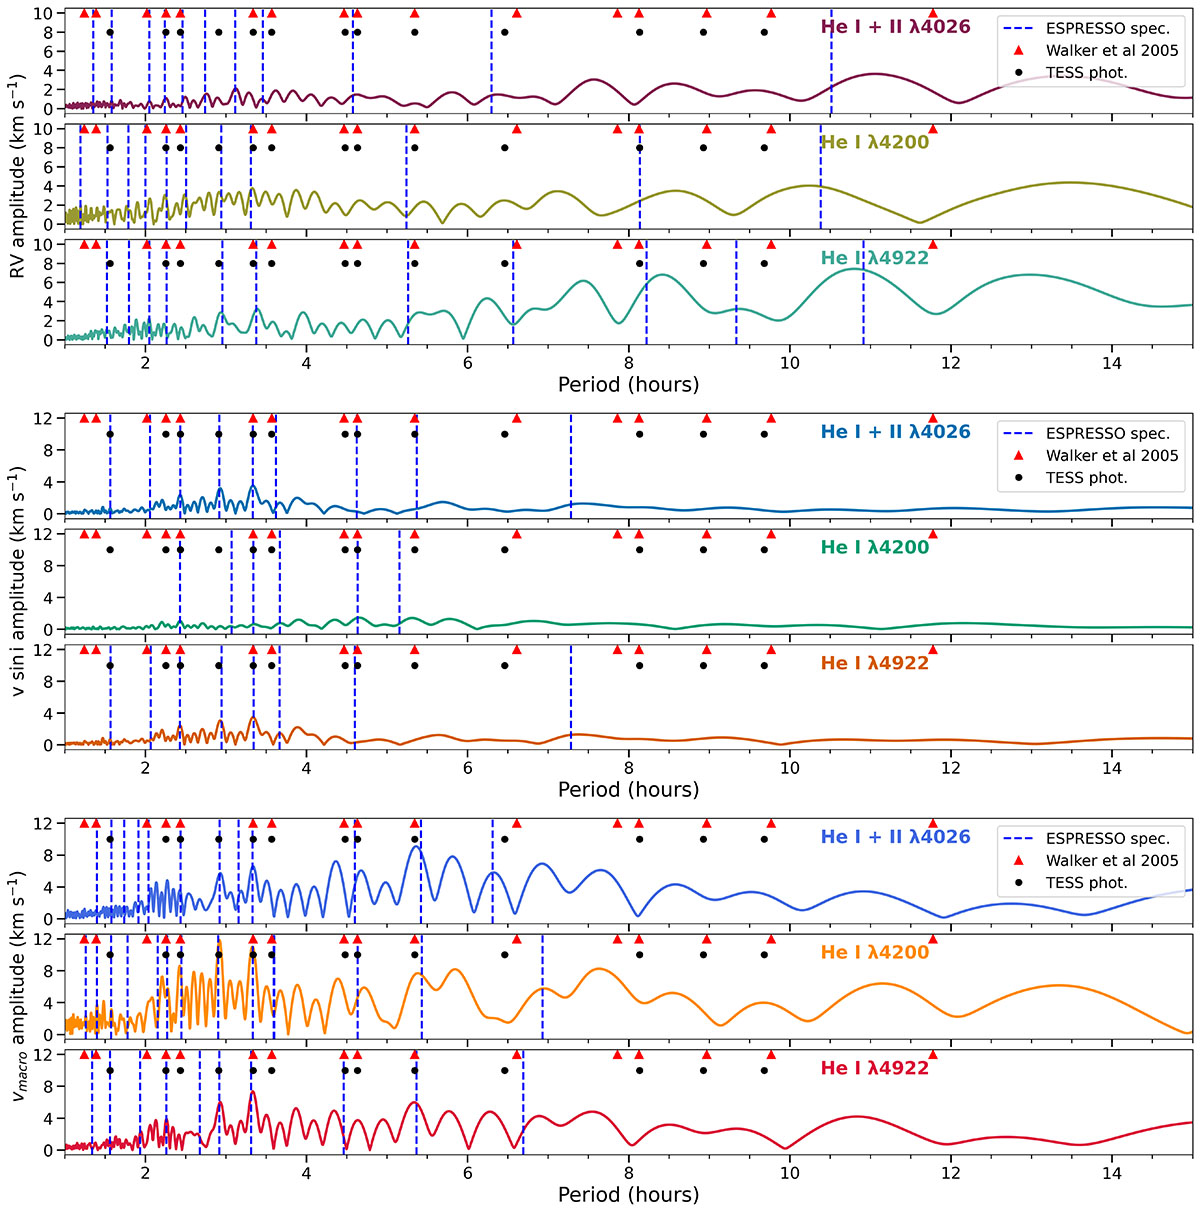
Fig. 10.
Download original image
From top to bottom: Lomb-Scargle periodograms for the RV, v sin i, and vmacro time series for the same three helium lines. In each panel, the dashed blue lines indicate the significant periods extracted for each spectroscopic time series using the pre-whitening method described in Sect. 3, the black circles indicate the pulsation periods extracted from the TESS light curve, and the red triangles correspond to the pulsation periods from ground-based and MOST photometry reported by Walker et al. (2005).
Current usage metrics show cumulative count of Article Views (full-text article views including HTML views, PDF and ePub downloads, according to the available data) and Abstracts Views on Vision4Press platform.
Data correspond to usage on the plateform after 2015. The current usage metrics is available 48-96 hours after online publication and is updated daily on week days.
Initial download of the metrics may take a while.