Fig. 3.
Download original image
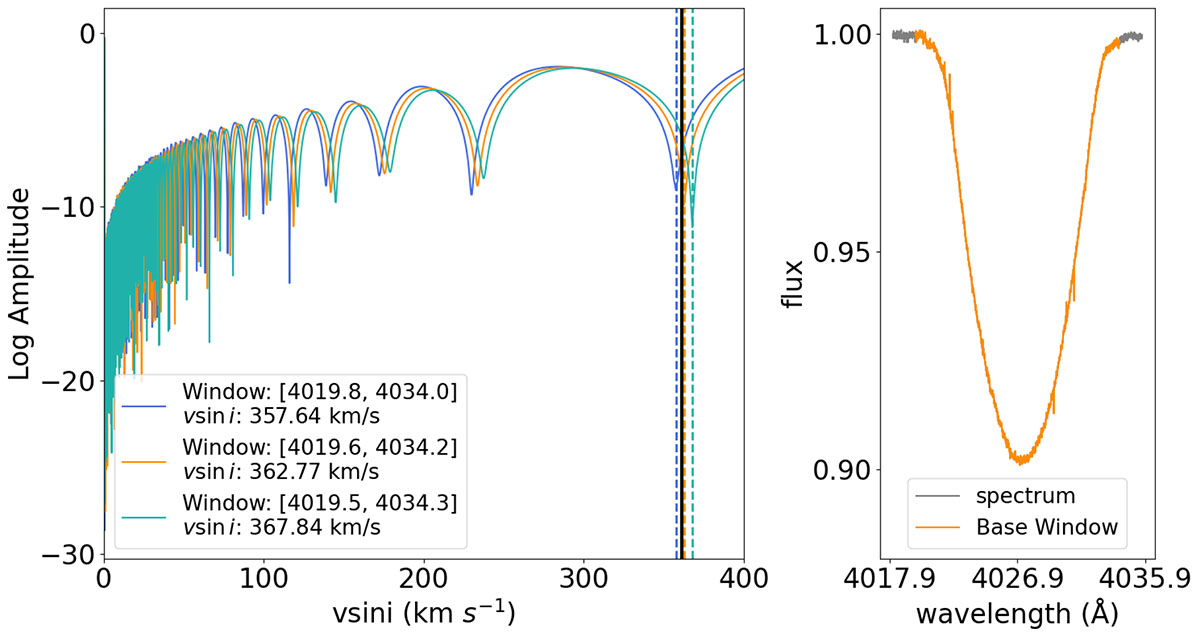
Left panel: Fourier transform of the line profile for different wavelength windows. The black line corresponds to the first minimum of the Fourier transform for the wavelength window shown in the right-hand panel. The coloured vertical dashed lines represent the first minimum of the Fourier transform obtained by adjusting the base window by ±0.1 Å the line profile. Right panel: Line profile for the He I+ IIλ4026 line in the stacked spectrum, with the selected wavelength window highlighted in orange.
Current usage metrics show cumulative count of Article Views (full-text article views including HTML views, PDF and ePub downloads, according to the available data) and Abstracts Views on Vision4Press platform.
Data correspond to usage on the plateform after 2015. The current usage metrics is available 48-96 hours after online publication and is updated daily on week days.
Initial download of the metrics may take a while.