Fig. 5.
Download original image
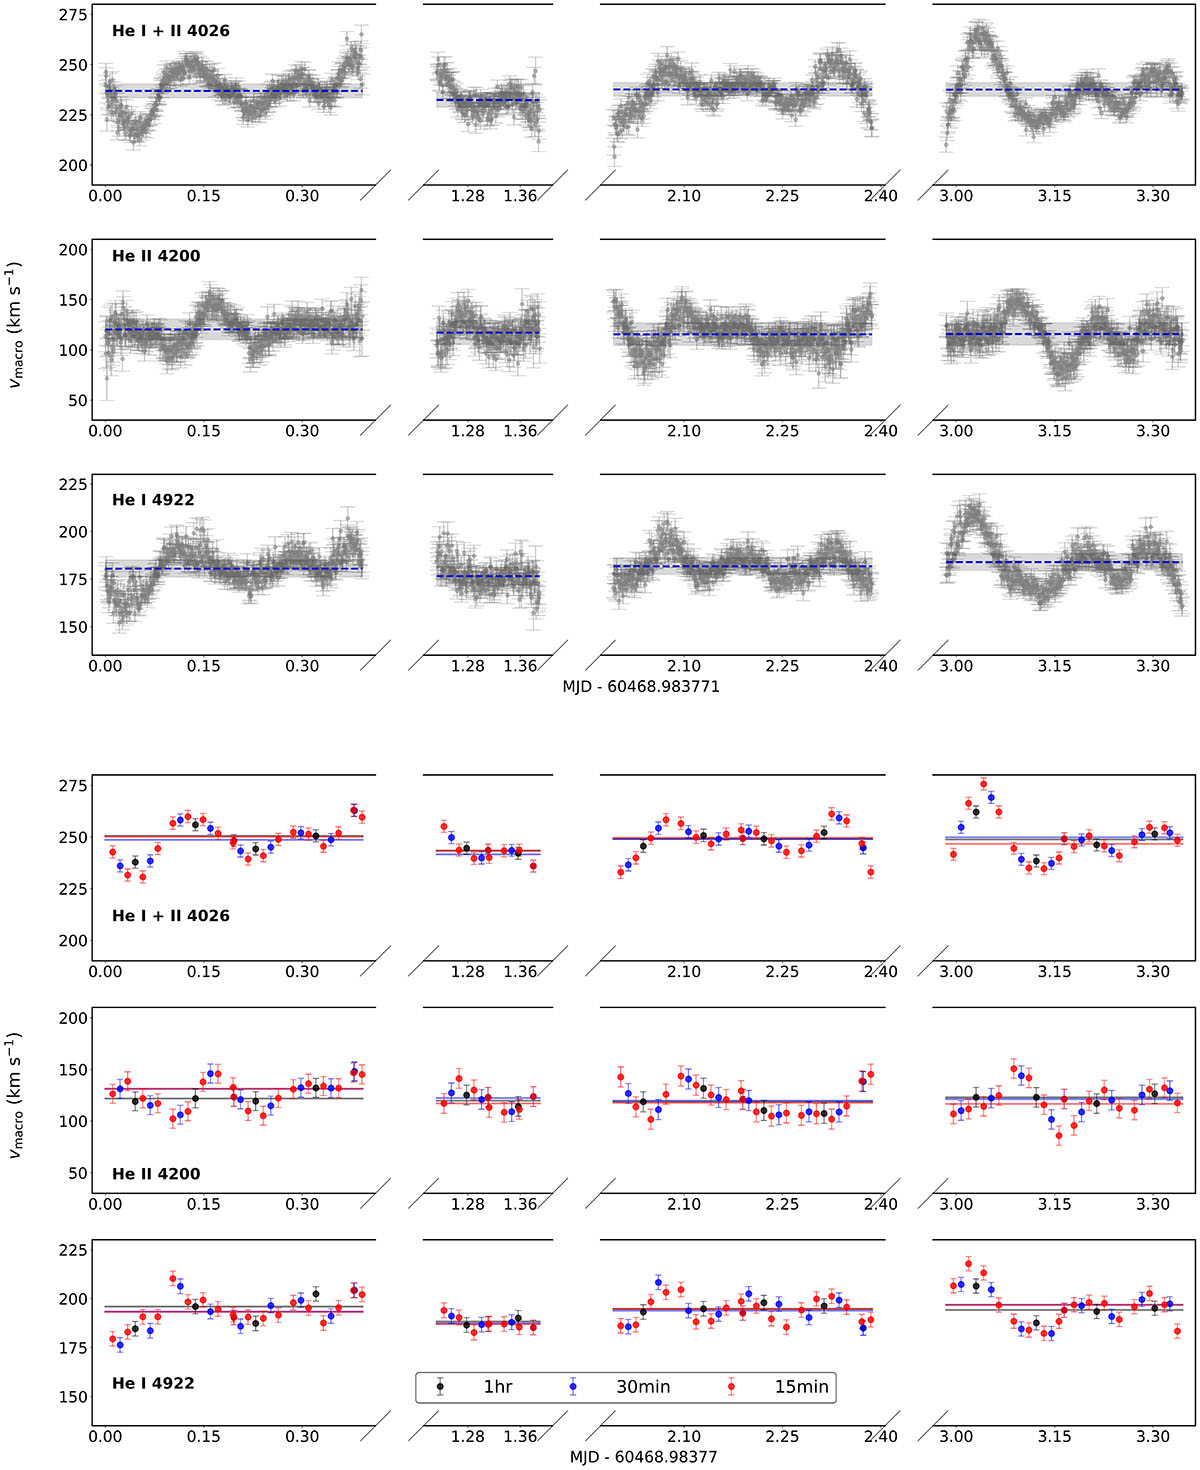
Macroturbulent velocity (vmacro) for three helium lines in ζ Oph, with the x-axis normalised to the time stamp of the first spectrum (i.e. MJD = 60468.983771). Top panel: time series of all 1706 spectra with 30 s exposure times (in grey). A peak-to-peak variability in vmacro of up to 88 km s−1 is seen. Dashed blue lines are the mean of the vmacro values for each night, which are consistent within their uncertainties as indicated by the shaded region. Bottom panel: vmacro time series for stacked spectra emulating 1 h (black), 30 min (blue), and 15 min (red) integration times. The peak-to-peak variability is diminished for longer integration times, but the mean vmacro is higher for longer integration times, with the nightly mean values denoted as solid lines.
Current usage metrics show cumulative count of Article Views (full-text article views including HTML views, PDF and ePub downloads, according to the available data) and Abstracts Views on Vision4Press platform.
Data correspond to usage on the plateform after 2015. The current usage metrics is available 48-96 hours after online publication and is updated daily on week days.
Initial download of the metrics may take a while.