Open Access
Fig. 8
Download original image
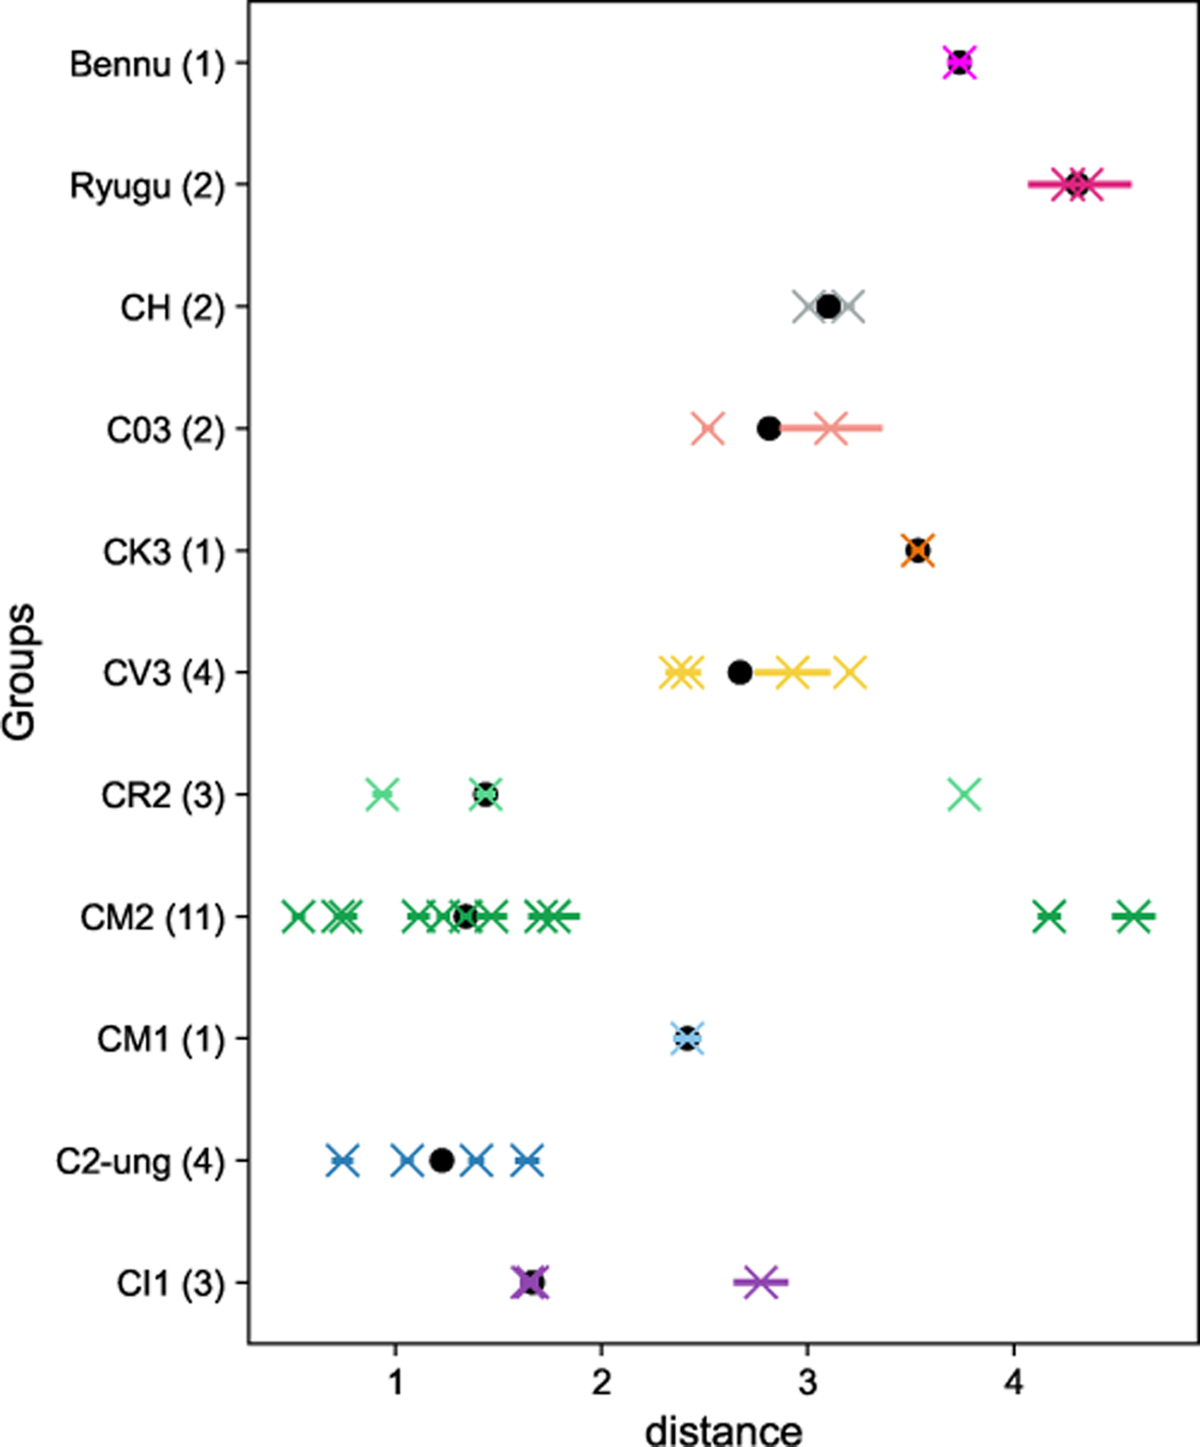
Euclidean distance of the samples (chondrites, Ryugu Bennu) to the spectrum of Klio. The samples have been merged into groups (the number of samples in each group is indicated in parenthesis). The black dot corresponds to the median of the distances within the group.
Current usage metrics show cumulative count of Article Views (full-text article views including HTML views, PDF and ePub downloads, according to the available data) and Abstracts Views on Vision4Press platform.
Data correspond to usage on the plateform after 2015. The current usage metrics is available 48-96 hours after online publication and is updated daily on week days.
Initial download of the metrics may take a while.