Fig. 1
Download original image
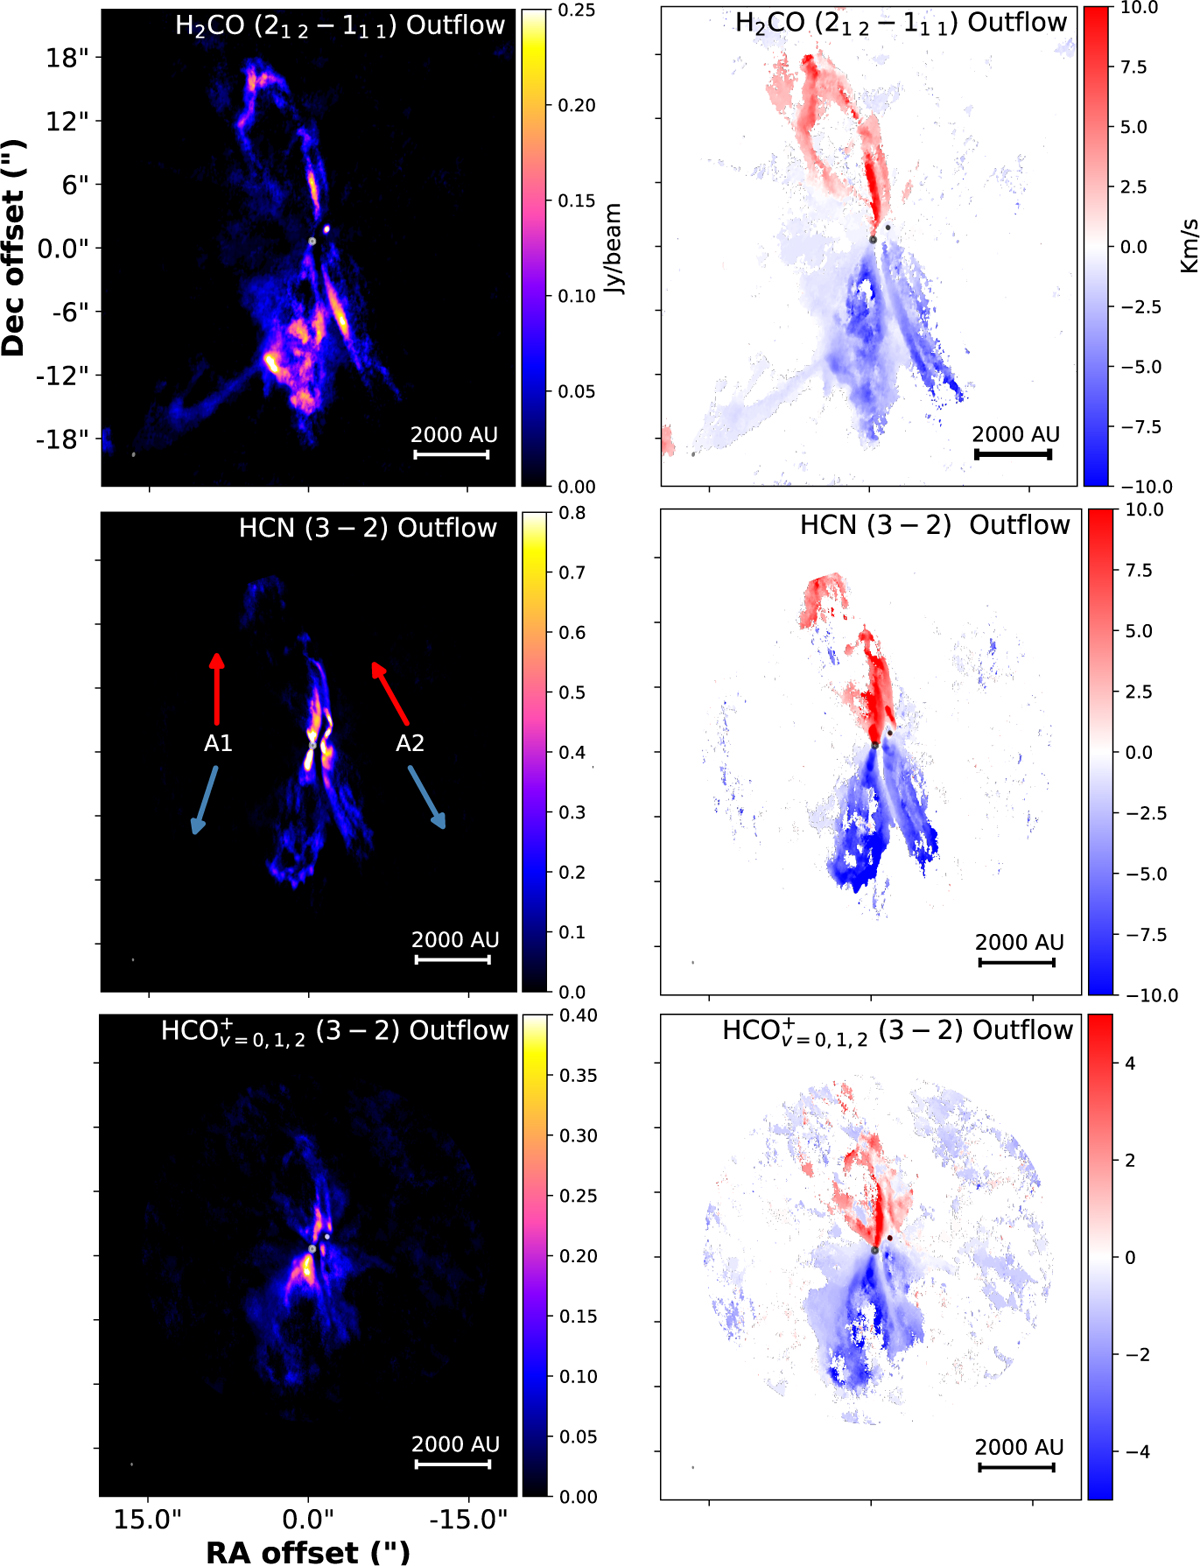
Integrated emission and velocity maps of the three main outflow tracers in our spectra - HCN, H2CO, and HCO+ - generated using the short baseline line data for IRAS4A. The emission from the outflows of both sources, IRAS4A1 and IRAS4A2, is resolved and can be distinguished separately. The dust continuum emission of IRAS4A1 and IRAS4A2 is outlined with small white contours showing 5 σ and 10 σ levels. The beam is drawn in the lower-left part of each panel, 0.28″ × 0.17″ for HCN and HCO+ and 0.44″ × 0.28″ for H2CO. The red and blue arrows in the middle-left panel indicate the outflow directions of IRAS4A1 (left) and IRAS4A2 (right), respectively (Chahine et al. 2024a).
Current usage metrics show cumulative count of Article Views (full-text article views including HTML views, PDF and ePub downloads, according to the available data) and Abstracts Views on Vision4Press platform.
Data correspond to usage on the plateform after 2015. The current usage metrics is available 48-96 hours after online publication and is updated daily on week days.
Initial download of the metrics may take a while.