Fig. 2
Download original image
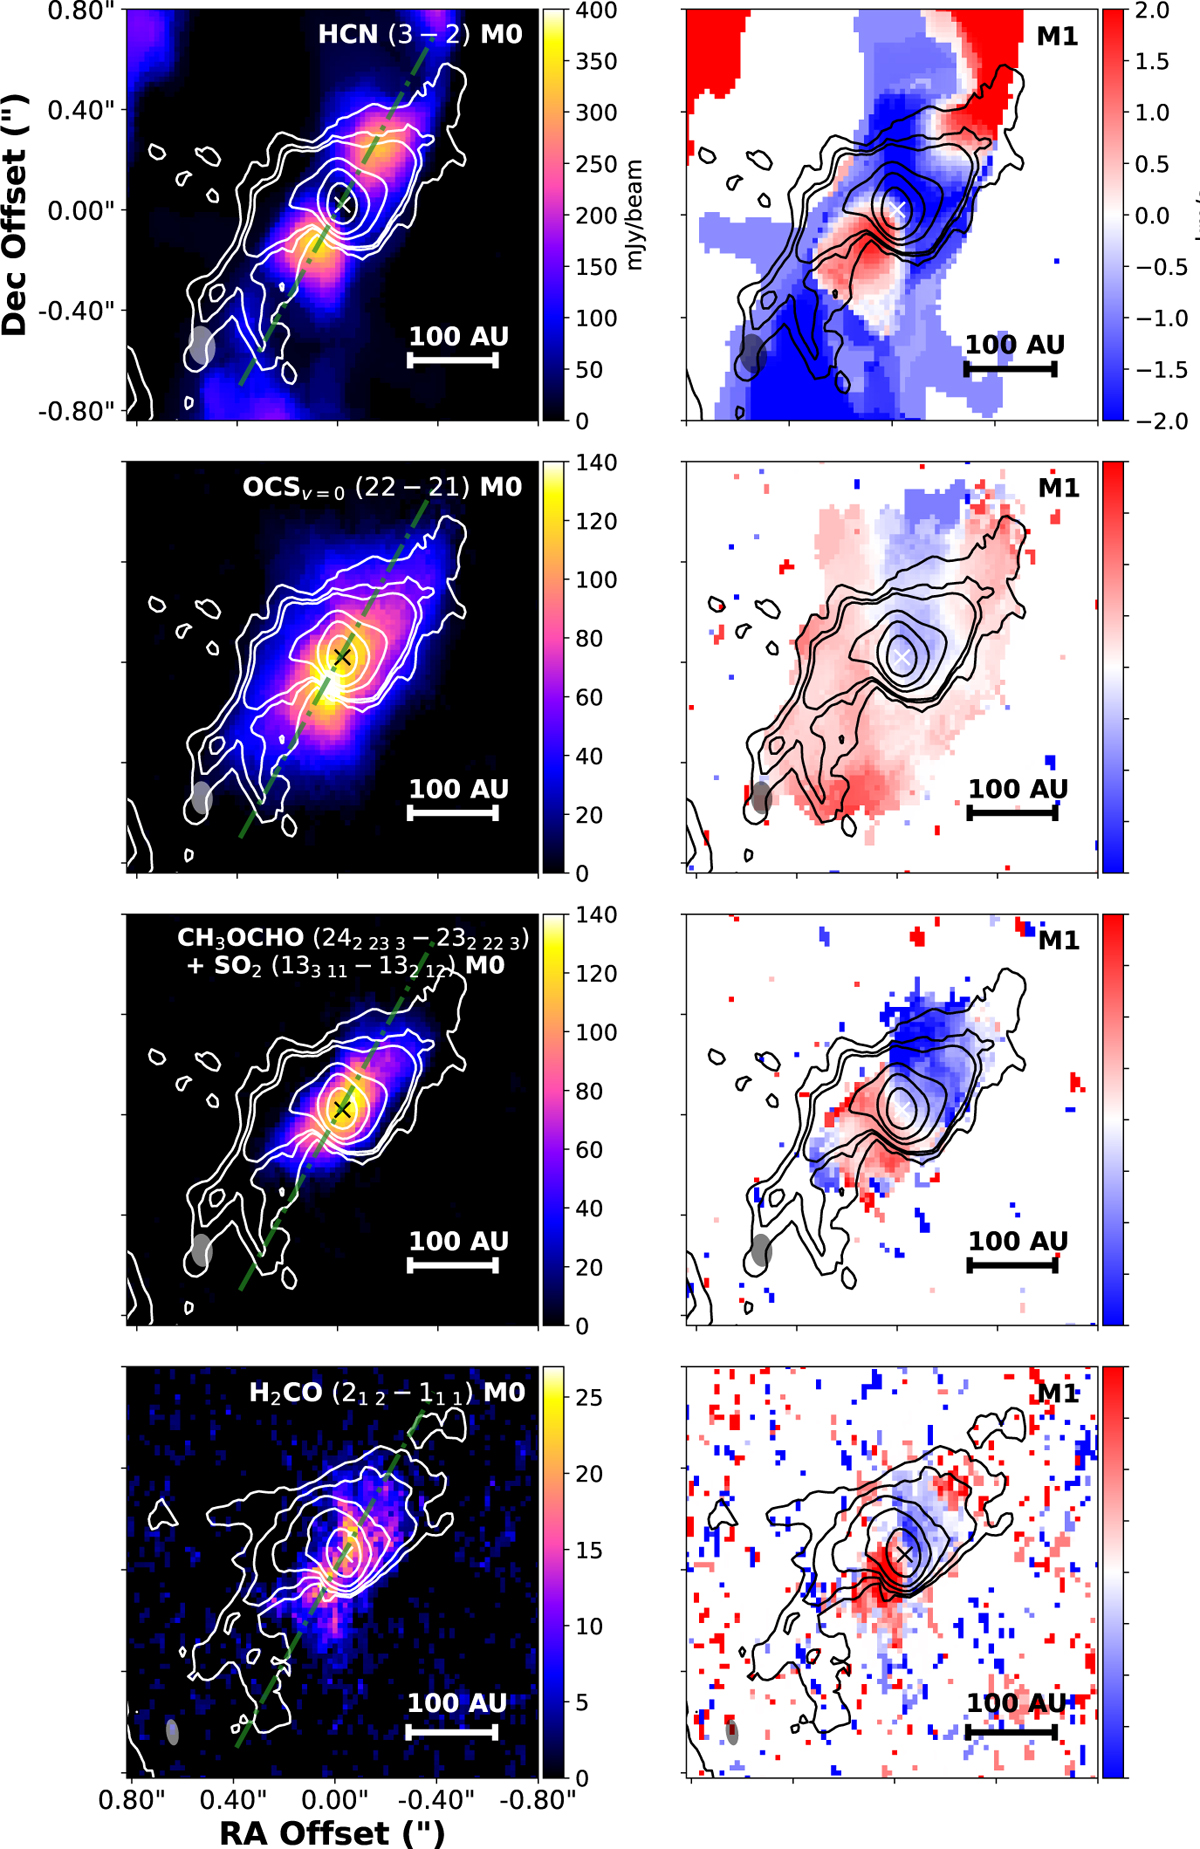
Integrated emission and velocity maps of SO2, OCS, H2CO, and HCN created using the long+short baseline data. These molecular lines trace a larger extended emission in IRAS4A2. We identified these features visually from the spectra as the most intense and spatially extended emission lines. The white and black contours represent the 6 to 60σ levels of the continuum emission from the ALMA Band 6 and Band 4 data, highlighting the underlying dust distribution. The synthesized beam is shown in the lower-left corner of all panels, and the dashed green lines indicate the cuts used to extract the P-V diagrams perpendicular to the outflow axis.
Current usage metrics show cumulative count of Article Views (full-text article views including HTML views, PDF and ePub downloads, according to the available data) and Abstracts Views on Vision4Press platform.
Data correspond to usage on the plateform after 2015. The current usage metrics is available 48-96 hours after online publication and is updated daily on week days.
Initial download of the metrics may take a while.