Fig. 3
Download original image
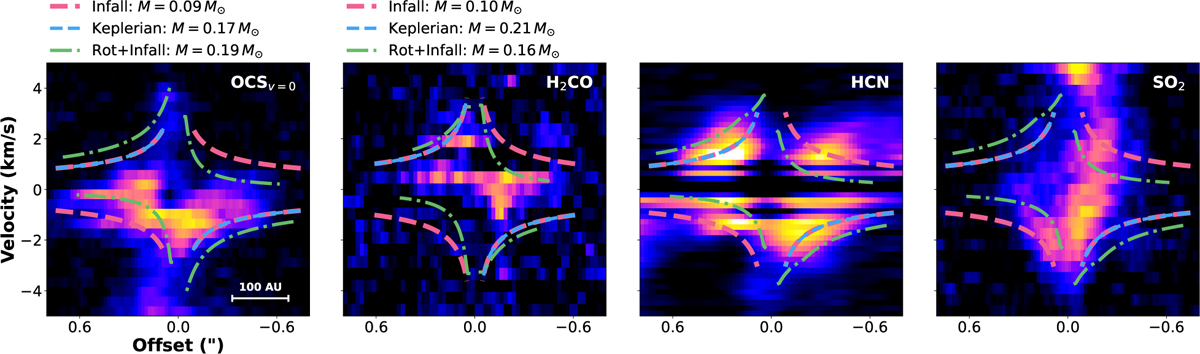
P-V diagrams of SO2, OCS, H2CO, and HCN extracted along a cut perpendicular to the jet axis. For OCS and H2CO, we fitted the emission using three kinematic models: pink lines represent the infall motion fit, blue lines the Keplerian rotation fit, and green lines the rotating infalling envelope model. The labels give the mass of the central protostar derived from each fit, and the negative offset marks the northwest direction. For SO2 and HCN, we overlay the model with the average of the fit parameters obtained from the models in OCS and H2CO for comparison, as their emission is more complicated.
Current usage metrics show cumulative count of Article Views (full-text article views including HTML views, PDF and ePub downloads, according to the available data) and Abstracts Views on Vision4Press platform.
Data correspond to usage on the plateform after 2015. The current usage metrics is available 48-96 hours after online publication and is updated daily on week days.
Initial download of the metrics may take a while.