Fig. 4
Download original image
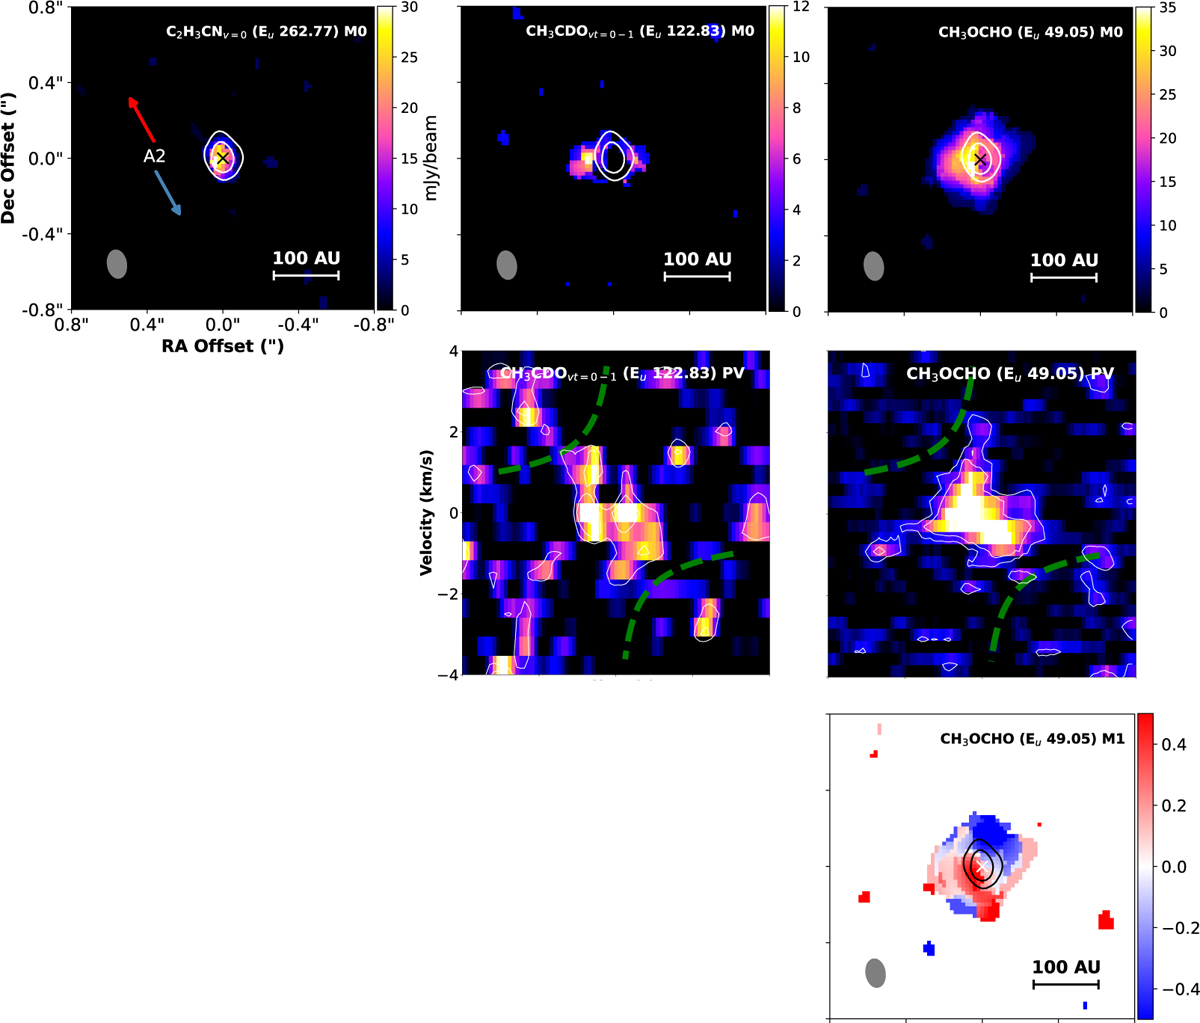
Top panels: integrated intensities of the three representative molecular lines that were not blended with any other, showcasing the three visually identified regions they trace within the IRAS4A2 disk: C2H3CN, CH3CDO, and CH3OCHO. The white contours show the 30 σ to 60 σ levels of the continuum emission, and the synthesized beams are indicated in the lower-left corner of each image. Middle panels: P-V diagrams of CH3CDO and CH3OCHO, extracted along a cut perpendicular to the outflow axis. The dashed green curve represents the Keplerian rotation model from H2CO, while white contours indicate emission levels from 1.5 σ to 3 σ, based on the Band 6 line data. Bottom panel: moment 1 (M1) map of CH3OCHO, indicating the velocity structure across the emitting region.
Current usage metrics show cumulative count of Article Views (full-text article views including HTML views, PDF and ePub downloads, according to the available data) and Abstracts Views on Vision4Press platform.
Data correspond to usage on the plateform after 2015. The current usage metrics is available 48-96 hours after online publication and is updated daily on week days.
Initial download of the metrics may take a while.