Fig. 5
Download original image
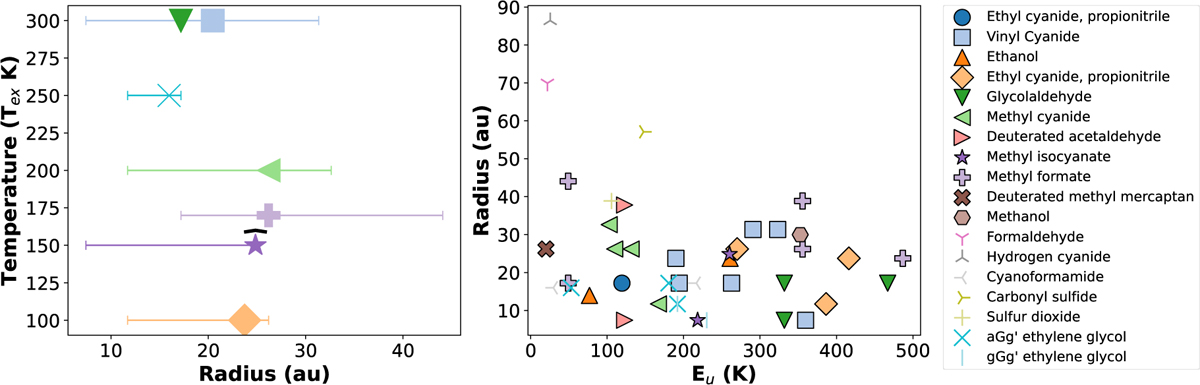
Left panel: deconvolved radii of the emission as a function of excitation temperature for the confirmed detected molecules in IRAS4A2. The error bars represent the minimum and maximum radii observed for all molecular lines, while the markers indicate the median radius values. All molecules have at least one blended transition, except for methyl isocyanate, which is highlighted with a black hat on top of its marker to indicate the absence of blending. Right panel: emission radius plotted against the upper state energy levels. Different colors and symbols represent emission from different molecules, as highlighted in the rightmost panel.
Current usage metrics show cumulative count of Article Views (full-text article views including HTML views, PDF and ePub downloads, according to the available data) and Abstracts Views on Vision4Press platform.
Data correspond to usage on the plateform after 2015. The current usage metrics is available 48-96 hours after online publication and is updated daily on week days.
Initial download of the metrics may take a while.