Fig. 10.
Download original image
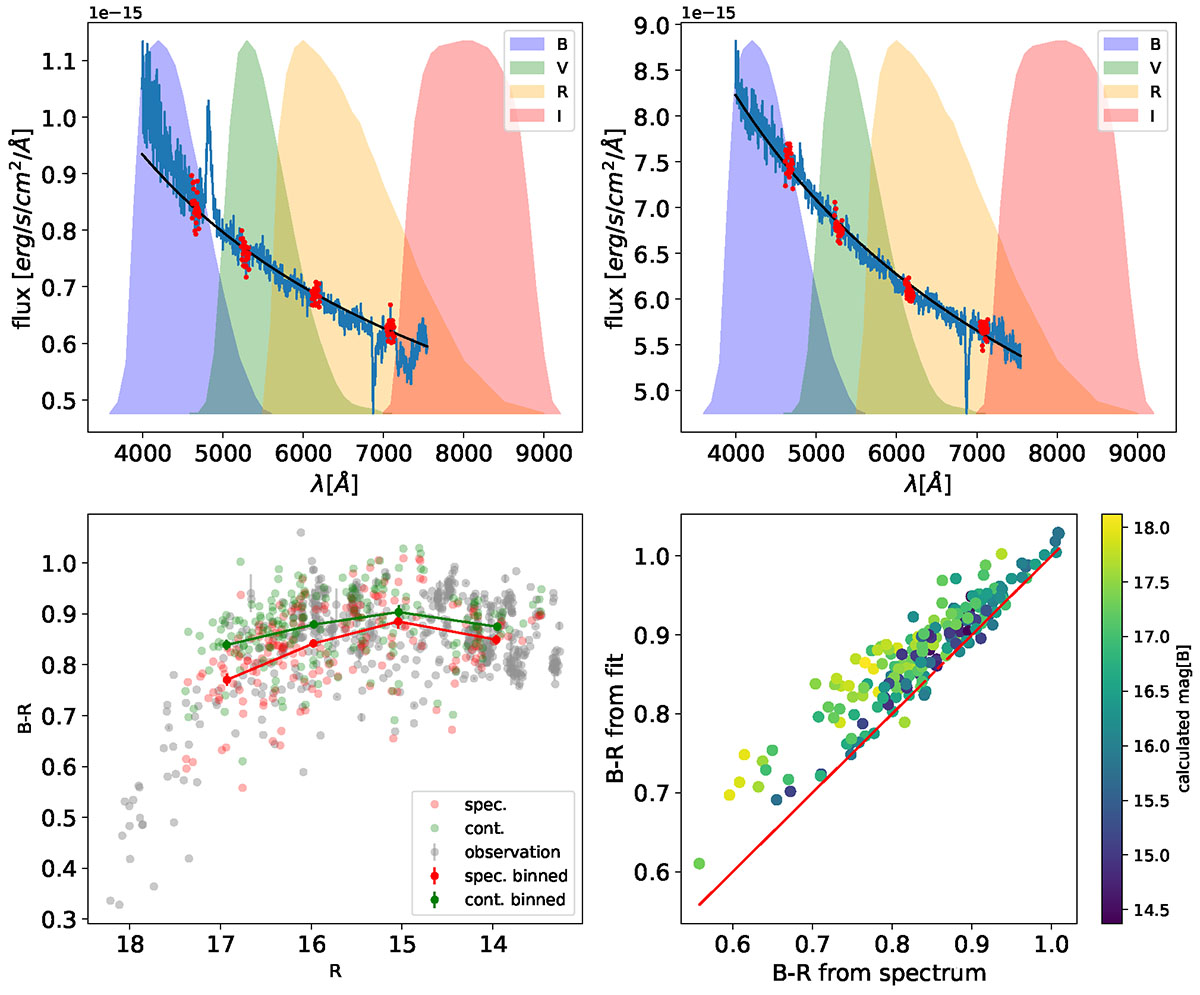
Top: Steward spectra in low (left) and high (right) flux states, with continuum fits (black) and BVRI filter curves. Bottom left: (B-R) vs. R color–magnitude diagram from observed (gray) and model-based (red/green) data. Bottom right: comparison of observed and continuum-based color indices. The color bar encodes B magnitude.
Current usage metrics show cumulative count of Article Views (full-text article views including HTML views, PDF and ePub downloads, according to the available data) and Abstracts Views on Vision4Press platform.
Data correspond to usage on the plateform after 2015. The current usage metrics is available 48-96 hours after online publication and is updated daily on week days.
Initial download of the metrics may take a while.