Open Access
Fig. A.1.
Download original image
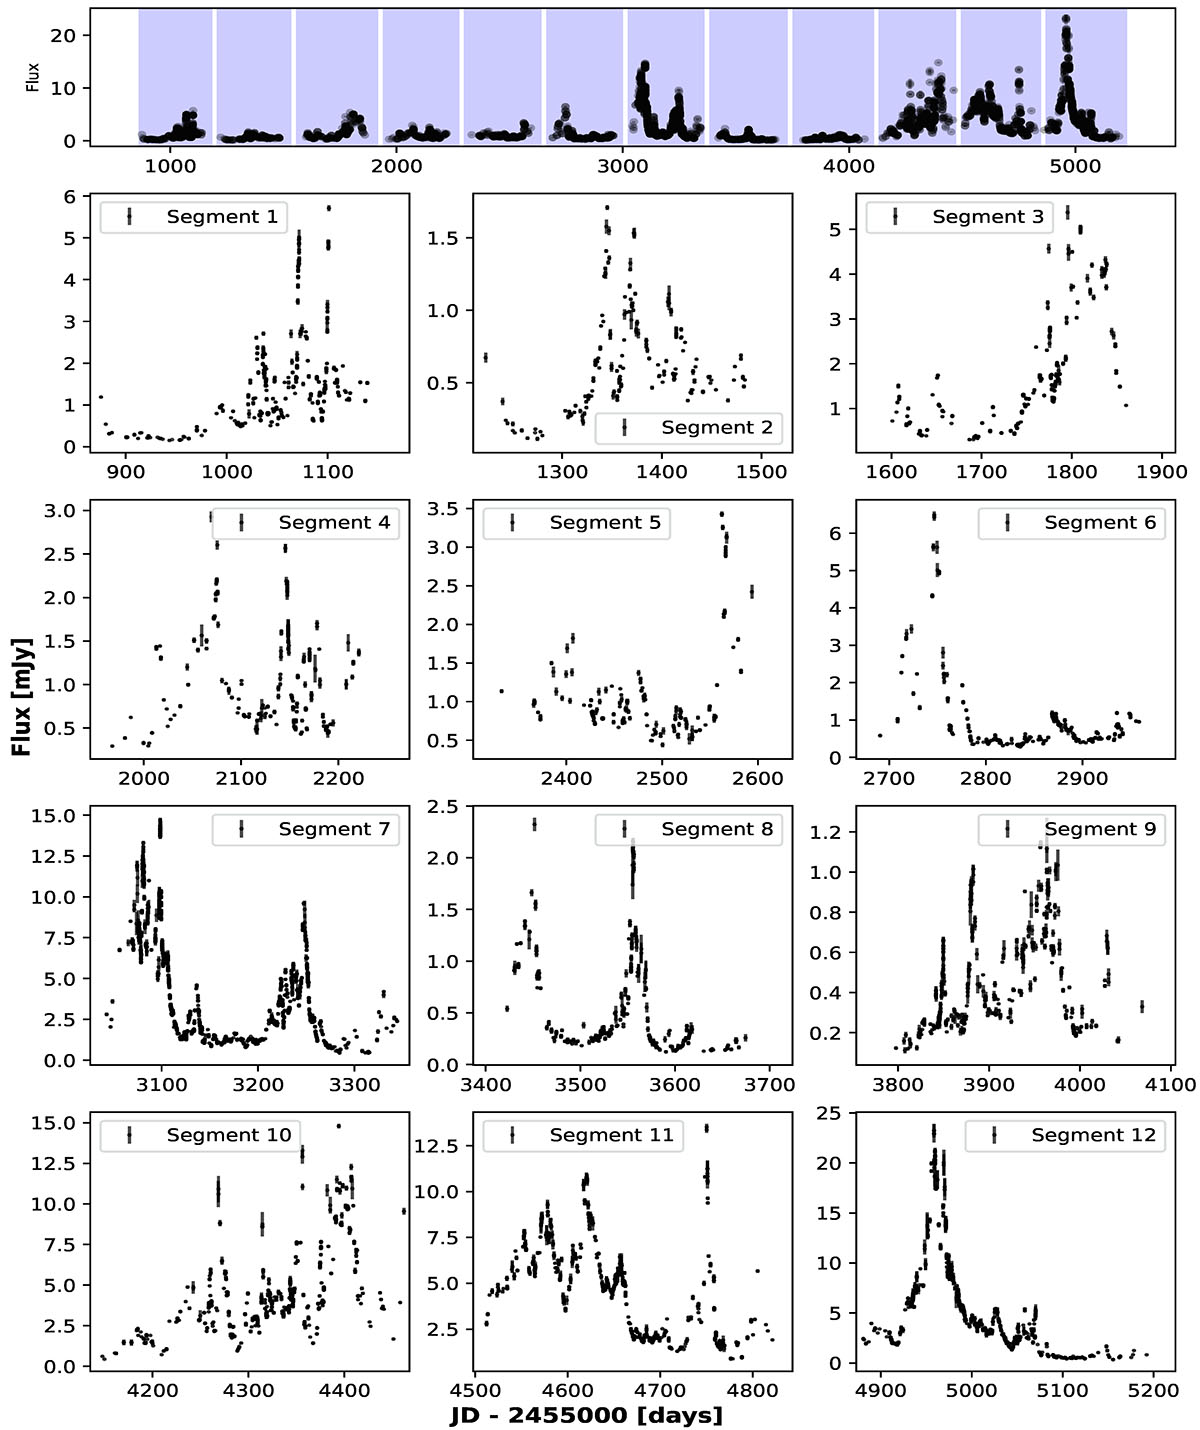
Light curve segmentation of the blazar Ton 599. The top panel shows the full light curve with 12 segments shaded in light blue, numbered from left to right. The lower panels provide a detailed view of each segment, arranged in a 4 × 3 grid.
Current usage metrics show cumulative count of Article Views (full-text article views including HTML views, PDF and ePub downloads, according to the available data) and Abstracts Views on Vision4Press platform.
Data correspond to usage on the plateform after 2015. The current usage metrics is available 48-96 hours after online publication and is updated daily on week days.
Initial download of the metrics may take a while.