Fig. 2
Download original image
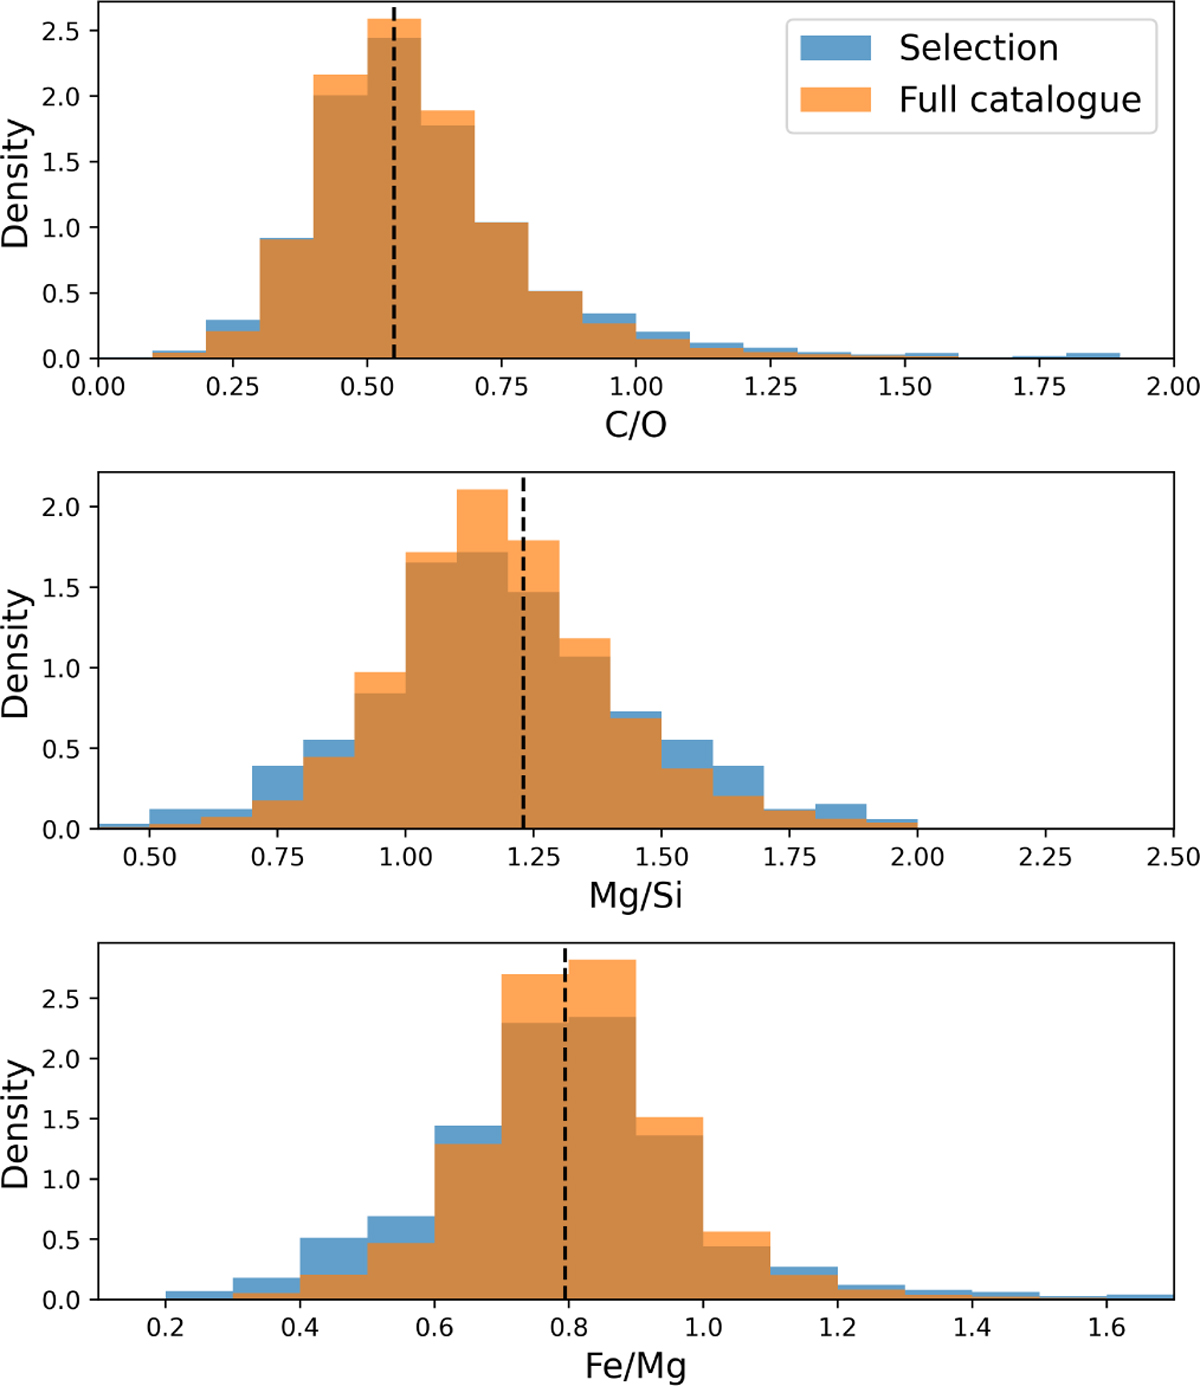
Stellar abundances within the GALAH catalogue (orange; Ν = 91 202) and within the sample for which we ran condensation sequence models (blue; Ν = 1000). Given our adjusted selection procedure, the selected sample places more emphasis on the tails of the distribution presented by the GALAH catalogue. Solar abundances are shown as a dashed black line (Asplund et al. 2009).
Current usage metrics show cumulative count of Article Views (full-text article views including HTML views, PDF and ePub downloads, according to the available data) and Abstracts Views on Vision4Press platform.
Data correspond to usage on the plateform after 2015. The current usage metrics is available 48-96 hours after online publication and is updated daily on week days.
Initial download of the metrics may take a while.