Fig. C.1
Download original image
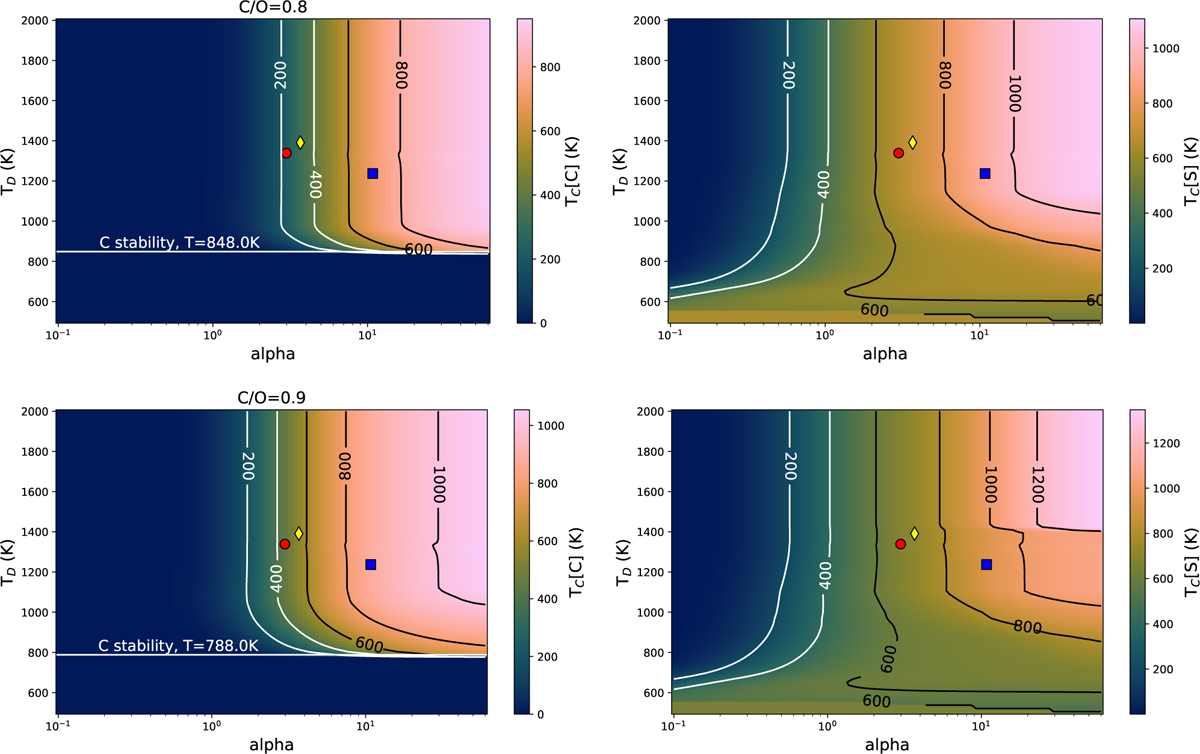
Effective condensation temperatures (K) of C (left) and S (right) as a function of the devolatilisation trend, in the shape of Eq. (4). The bulk disk composition is solar (Lodders 2003), adjusting only C and Ο abundances such that bulk disk C/O ratios are 0.8 (top) and 0.9 (bottom), while conserving ![]() . We show TD = 10−β/α rather than parameter β on the y-axis. In addition, we show the lowest TD in which C may still condense. The devolatilisation trends of Earth (yellow diamond), Mars (red circle), and Vesta (blue square) are indicated.
. We show TD = 10−β/α rather than parameter β on the y-axis. In addition, we show the lowest TD in which C may still condense. The devolatilisation trends of Earth (yellow diamond), Mars (red circle), and Vesta (blue square) are indicated.
Current usage metrics show cumulative count of Article Views (full-text article views including HTML views, PDF and ePub downloads, according to the available data) and Abstracts Views on Vision4Press platform.
Data correspond to usage on the plateform after 2015. The current usage metrics is available 48-96 hours after online publication and is updated daily on week days.
Initial download of the metrics may take a while.