Fig. 5
Download original image
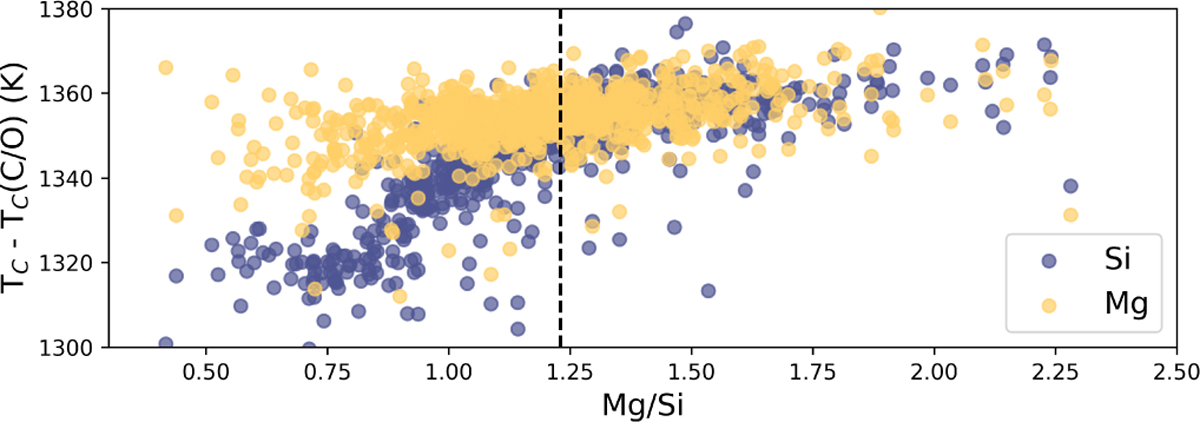
Condensation temperatures (TC) of Mg and Si, after subtracting a fit to the C/O-dependence of ![]() and
and ![]() (Fig. 4), plotted against the disk Mg/Si ratios. Here, a trend emerges between TC and the molar Mg/Si ratio of the disk (bottom) for Si, but not for Mg. Solar Mg/Si=1.23 (Asplund et al. 2009) is indicated as a vertical dashed line. Condensation temperatures are derived from condensation sequence calculations at P = 10−4 bar.
(Fig. 4), plotted against the disk Mg/Si ratios. Here, a trend emerges between TC and the molar Mg/Si ratio of the disk (bottom) for Si, but not for Mg. Solar Mg/Si=1.23 (Asplund et al. 2009) is indicated as a vertical dashed line. Condensation temperatures are derived from condensation sequence calculations at P = 10−4 bar.
Current usage metrics show cumulative count of Article Views (full-text article views including HTML views, PDF and ePub downloads, according to the available data) and Abstracts Views on Vision4Press platform.
Data correspond to usage on the plateform after 2015. The current usage metrics is available 48-96 hours after online publication and is updated daily on week days.
Initial download of the metrics may take a while.