Fig. 6
Download original image
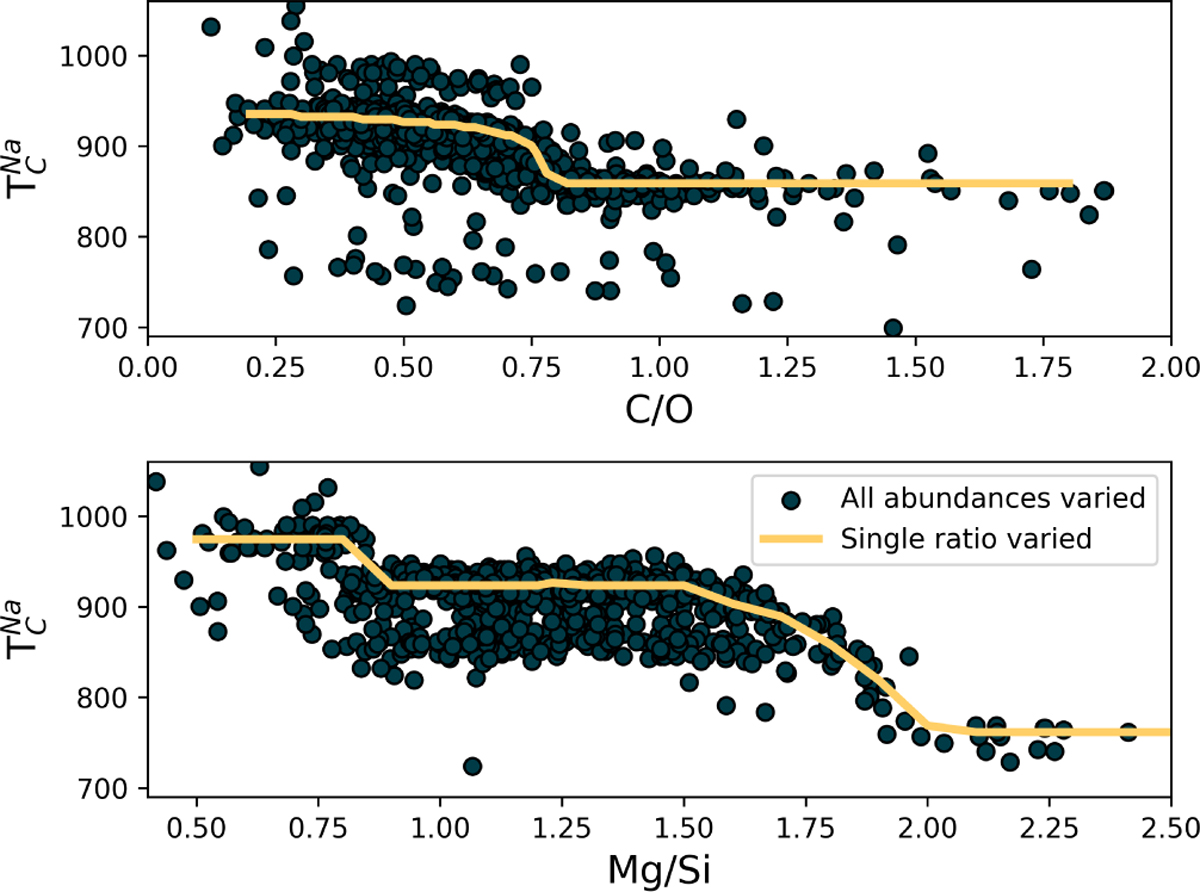
Condensation temperature (Tc) of Na, plotted against the molar disk C/O (top) and Mg/Si (bottom). Dots represent simulation results based on stellar abundance data for individual stars. Lines represent results for solar abundances with varying C (top) or varying Mg and Si while conserving bulk Mg+Si (bottom). Temperatures are derived from condensation sequence calculations at P = 10−4 bar.
Current usage metrics show cumulative count of Article Views (full-text article views including HTML views, PDF and ePub downloads, according to the available data) and Abstracts Views on Vision4Press platform.
Data correspond to usage on the plateform after 2015. The current usage metrics is available 48-96 hours after online publication and is updated daily on week days.
Initial download of the metrics may take a while.