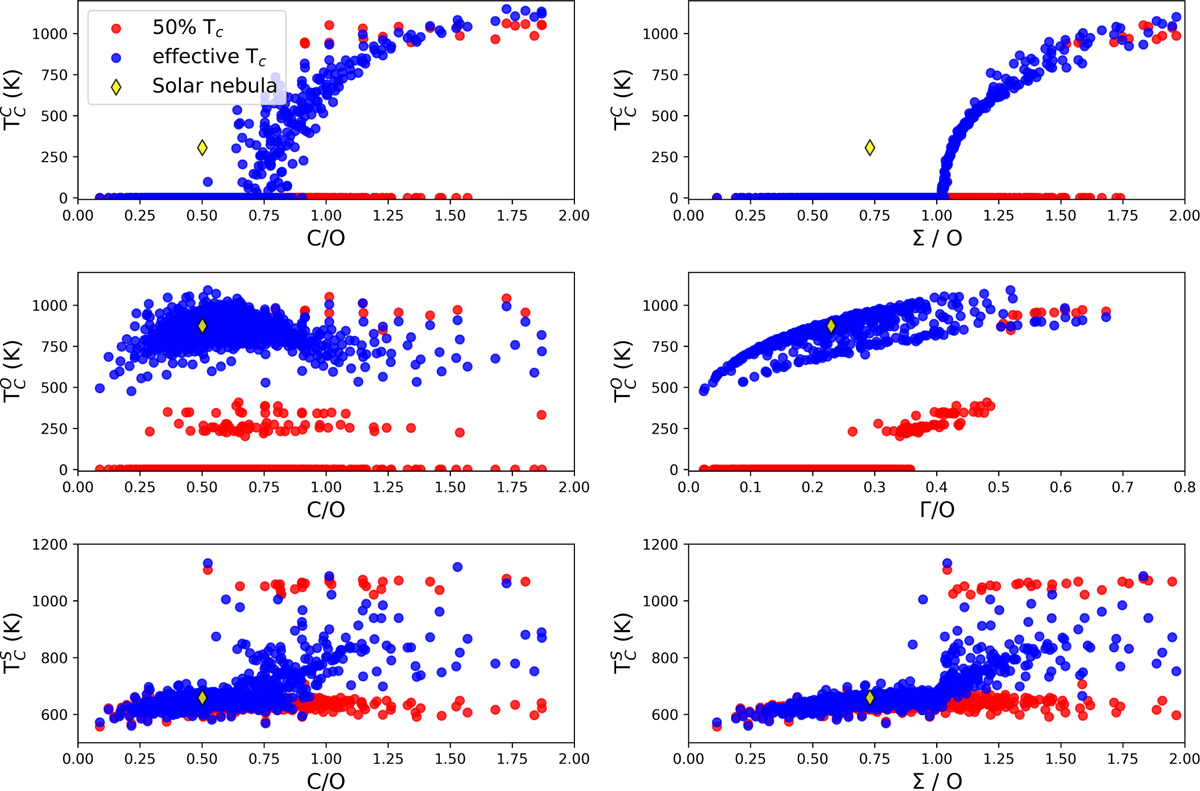
Fig. 8
Download original image
Condensation temperatures of C (top), O (middle), and S (bottom) in disks with varying compositions. Temperatures are plotted against molar C/O ratios of disks (left) and Σ/O, which is defined as the sum of all elements binding with oxygen, multiplied with their oxide stoichiometry, divided by the oxygen abundance, or Γ/O, where Γ = Σ – ϵC (right). The 50% condensation temperatures are shown as red dots, while effective condensation temperatures (see text) are shown as blue dots. Condensation temperatures are derived from condensation sequence calculations at P = 10−4 bar.
Current usage metrics show cumulative count of Article Views (full-text article views including HTML views, PDF and ePub downloads, according to the available data) and Abstracts Views on Vision4Press platform.
Data correspond to usage on the plateform after 2015. The current usage metrics is available 48-96 hours after online publication and is updated daily on week days.
Initial download of the metrics may take a while.