Fig. C.3
Download original image
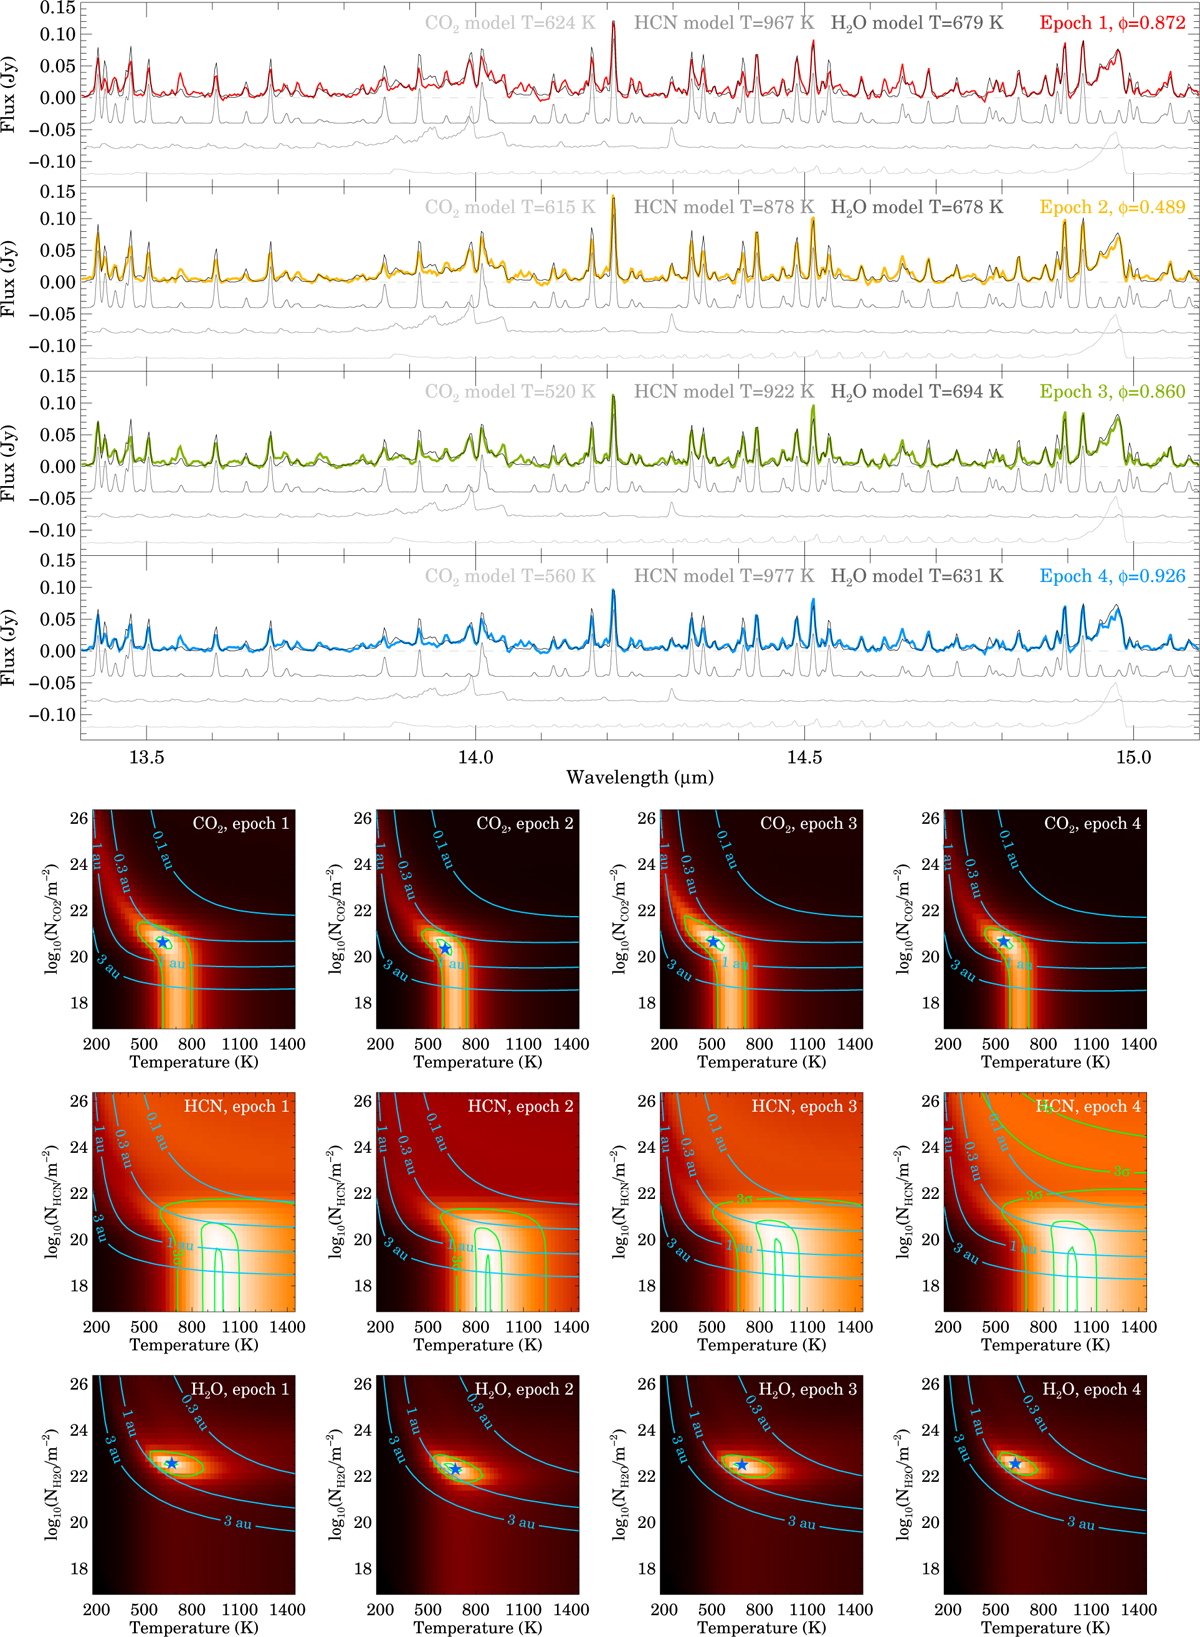
Top: observed spectra of DQ Tau (in color) with the best-fitting CO2, H2O, and HCN slab models fitted for the 13.4–15.1 µm wavelength range. For clarity, the models for the individual molecules (gray curves) were shifted along the y axis. The total model (in black) is the sum of the three individual models and is not shifted. Bottom: ![]() surfaces with the 1σ, 2σ, 3σ contours marked in green and the centroid marked with the blue asterisk. The color scale goes from 0 (black) to 1 (white). The blue curves show the best-fitting slab radii for certain N-T pairs assuming a circular emitting area.
surfaces with the 1σ, 2σ, 3σ contours marked in green and the centroid marked with the blue asterisk. The color scale goes from 0 (black) to 1 (white). The blue curves show the best-fitting slab radii for certain N-T pairs assuming a circular emitting area.
Current usage metrics show cumulative count of Article Views (full-text article views including HTML views, PDF and ePub downloads, according to the available data) and Abstracts Views on Vision4Press platform.
Data correspond to usage on the plateform after 2015. The current usage metrics is available 48-96 hours after online publication and is updated daily on week days.
Initial download of the metrics may take a while.