Fig. 4
Download original image
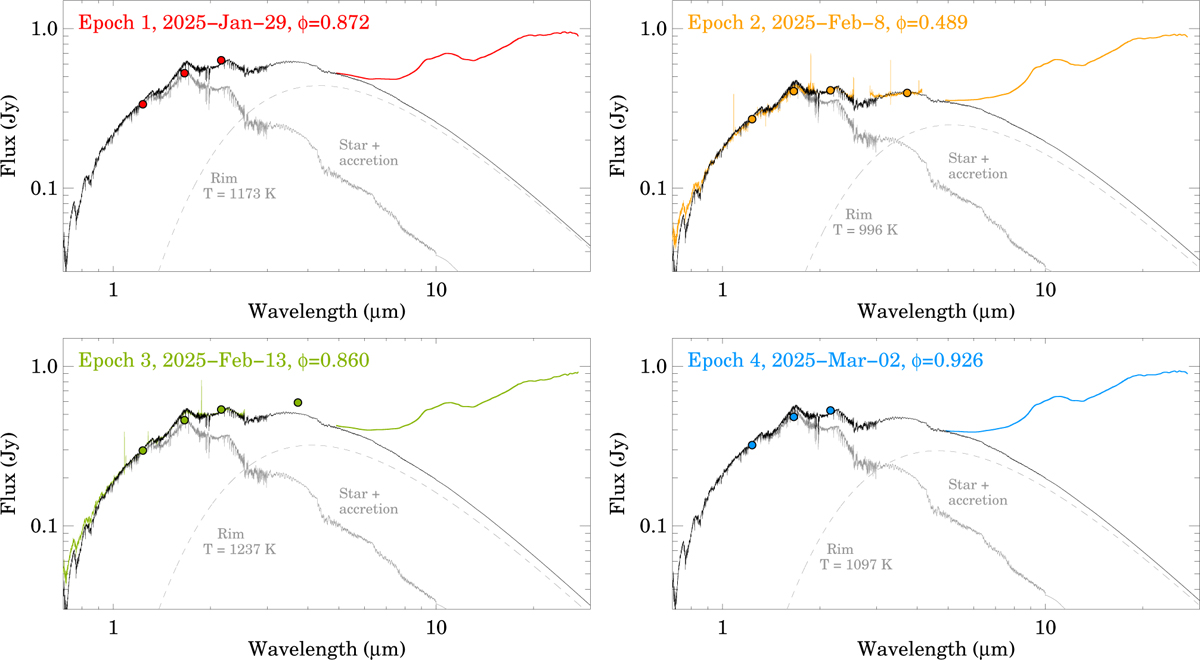
Spectral energy distributions of DQ Tau at the four epochs of the JWST/MIRI observations. The spectra in the range 0.7–5.3 µm are from IRTF/SpeX, while the spectra in the range 4.9–27.5 µm are the line-free MIRI spectra. The colored dots are REM JHK and SpeX L′ photometric points. The solid gray spectra are models constructed to account for the stellar and accretion contributions. The dashed gray curves are blackbodies with the indicated temperatures, representing emission from the inner rim of the dusty disk. The solid black curves are the sum of the stellar, accretion, and rim contributions.
Current usage metrics show cumulative count of Article Views (full-text article views including HTML views, PDF and ePub downloads, according to the available data) and Abstracts Views on Vision4Press platform.
Data correspond to usage on the plateform after 2015. The current usage metrics is available 48-96 hours after online publication and is updated daily on week days.
Initial download of the metrics may take a while.