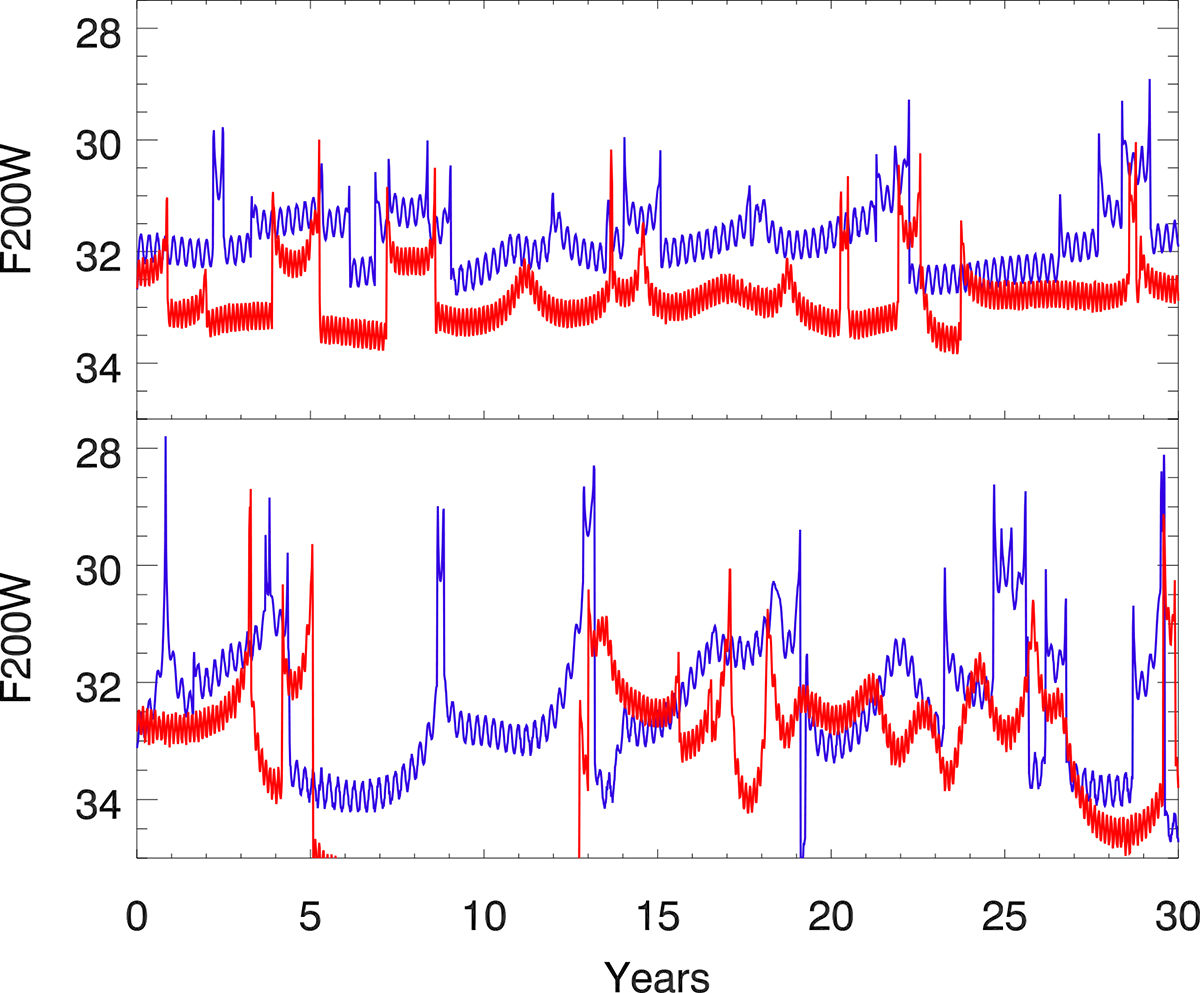
Fig. 10.
Download original image
Simulated light curve of two Cepheids under the effect of microlensing with periods 25 days (red) and 50 days (blue). Top: Case of Cepheids moving across the web of microcaustics in a portion of the Dragon with positive parity. Bottom: Same Cepheids but on the portion of the Dragon with negative parity. In both cases, the macromodel magnification is μ = 161 and the observations is assumed to be carried out in the JWST’s F200W filter (corresponding J-band in the rest frame for a Cepheid in the Dragon). For the blue curve in the bottom panel (P = 25 days and negative parity), the Cepheid is brighter than 30.5 mag 8% of the time while the red curve (P = 25 days and negative parity) is above this limit only 1% of the time.
Current usage metrics show cumulative count of Article Views (full-text article views including HTML views, PDF and ePub downloads, according to the available data) and Abstracts Views on Vision4Press platform.
Data correspond to usage on the plateform after 2015. The current usage metrics is available 48-96 hours after online publication and is updated daily on week days.
Initial download of the metrics may take a while.