Open Access
Fig. 11.
Download original image
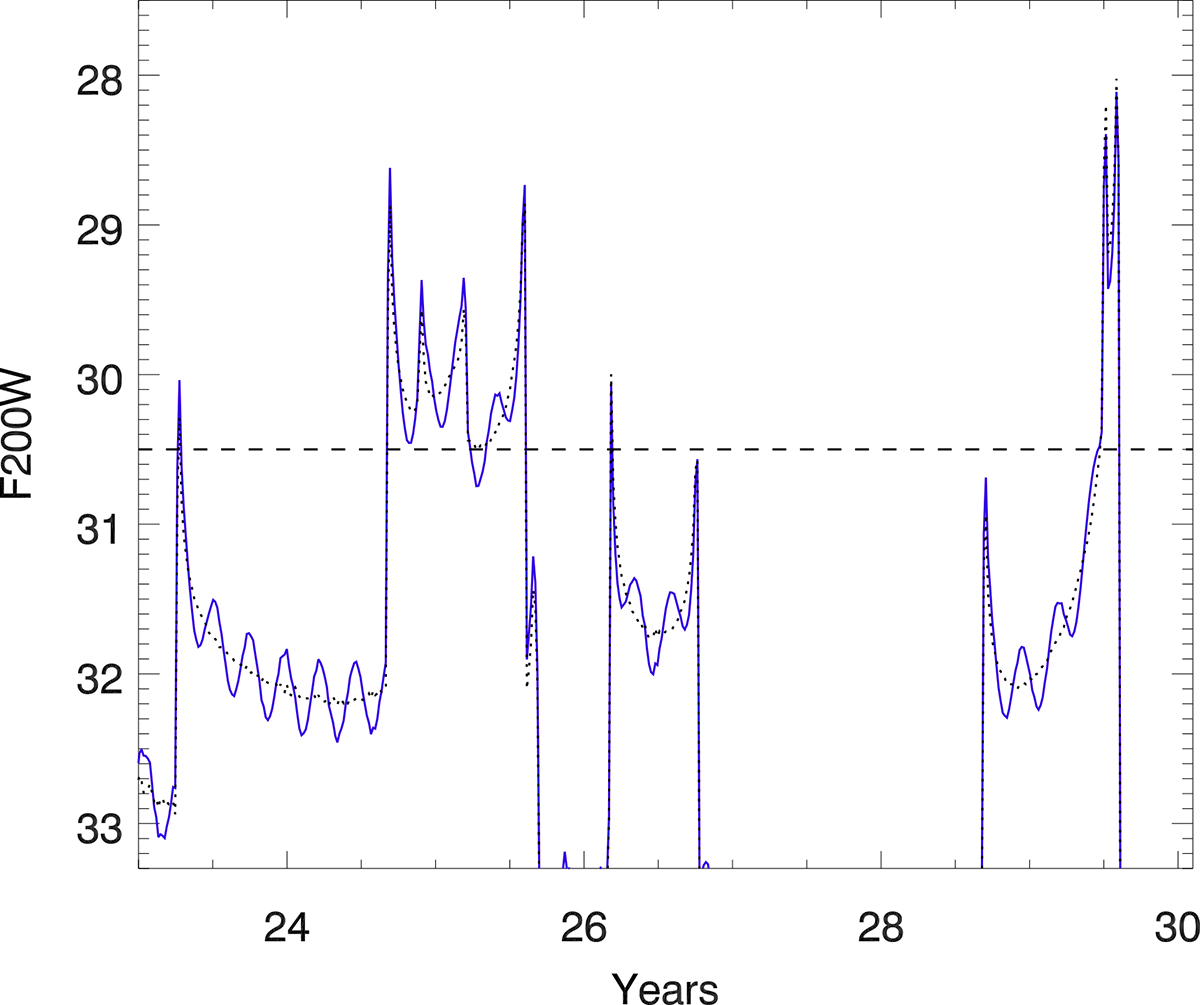
Zoom in a portion of the light curve for the 50 day period Cepheid with negative parity in Fig. 10. The dotted line shows the effect of magnification from the macromodel and microlenses. The dashed line marks the detection limit in this filter with JWST in deep observations (≈15 hour exposure).
Current usage metrics show cumulative count of Article Views (full-text article views including HTML views, PDF and ePub downloads, according to the available data) and Abstracts Views on Vision4Press platform.
Data correspond to usage on the plateform after 2015. The current usage metrics is available 48-96 hours after online publication and is updated daily on week days.
Initial download of the metrics may take a while.