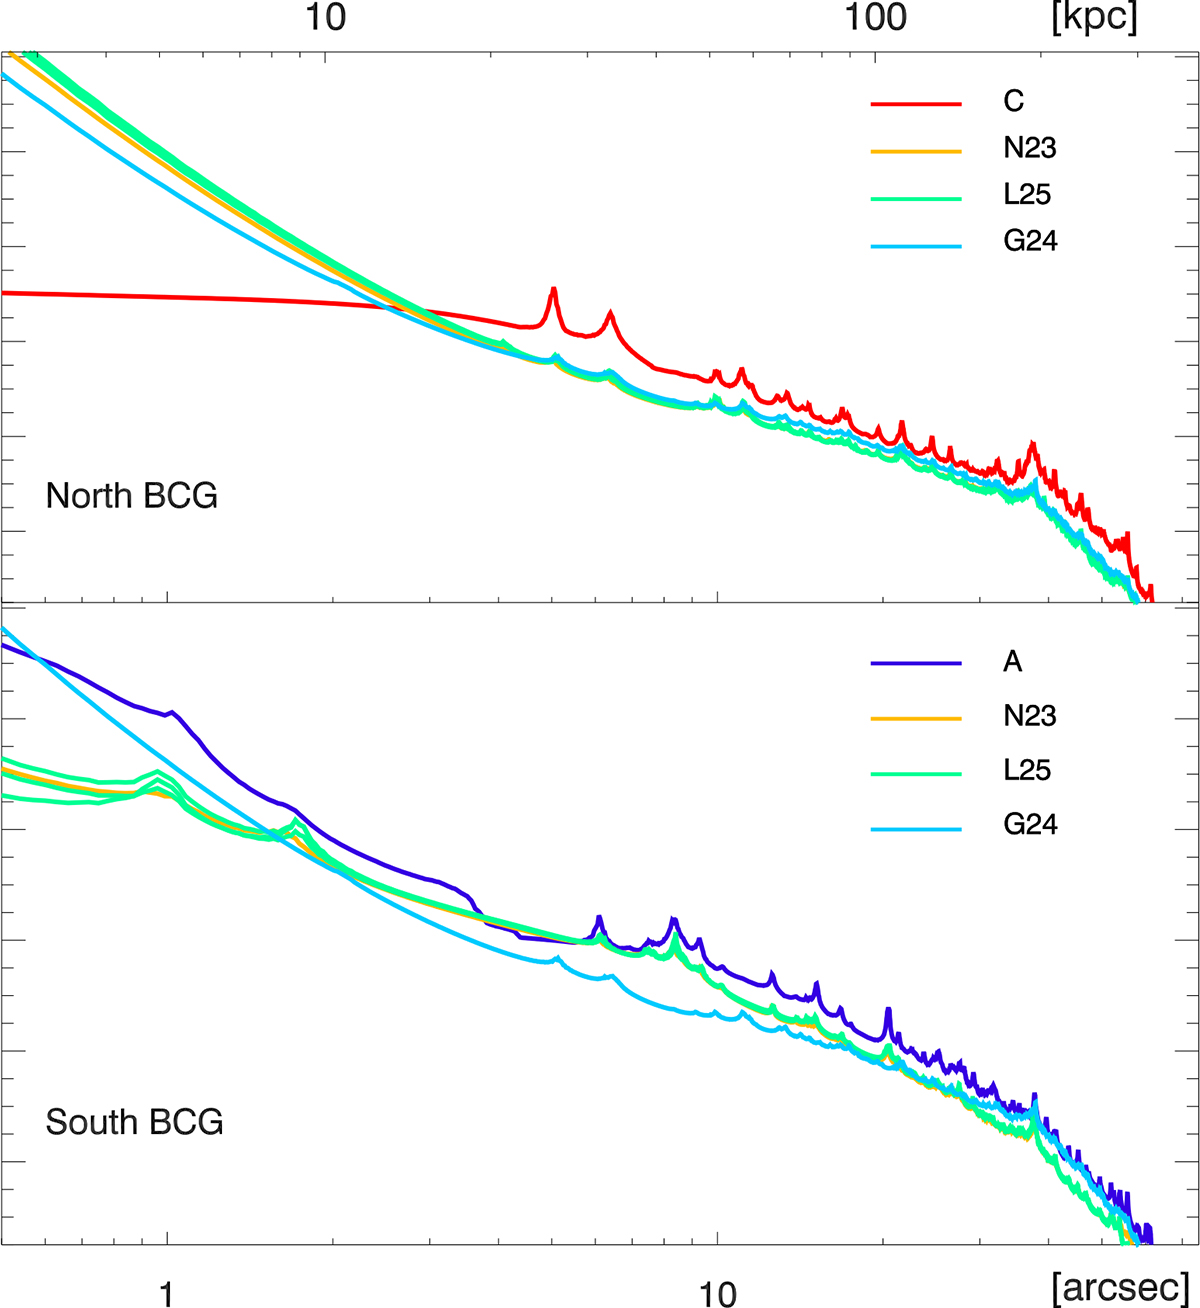
Fig. A.1.
Download original image
Orange lines (N23) refer to the parametric model in Niemiec et al. (2023). Green lines (L25) refer to the three models in Limousin et al. (2025). Light-blue lines, G24, are for the model in Gledhill et al. (2024). The red line in the top panel is for our model C, while the dark-blue line in the bottom panel is for our A model.
Current usage metrics show cumulative count of Article Views (full-text article views including HTML views, PDF and ePub downloads, according to the available data) and Abstracts Views on Vision4Press platform.
Data correspond to usage on the plateform after 2015. The current usage metrics is available 48-96 hours after online publication and is updated daily on week days.
Initial download of the metrics may take a while.