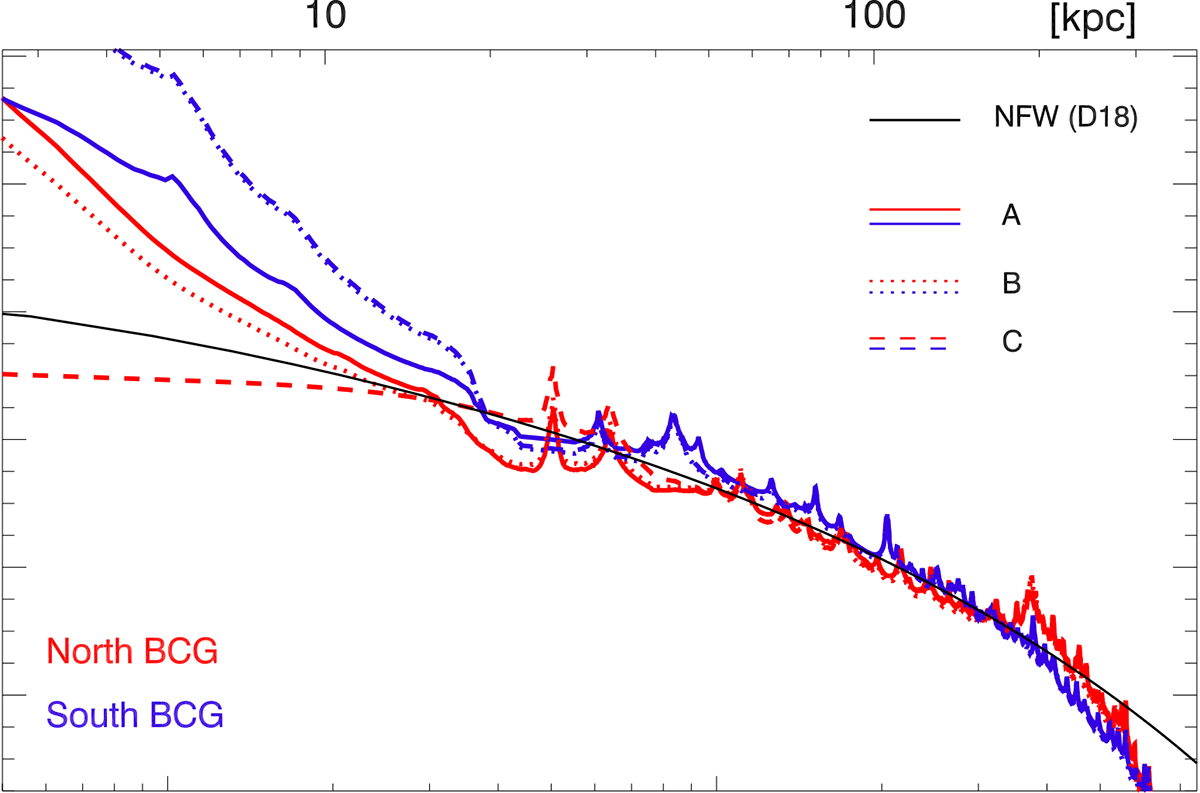
Fig. 2.
Download original image
Mass profile of the lens models A, B, and C. Red curves correspond to the radial profiles when the center is the north BCG, while the blue curves correspond to the profiles centered in the south BCG. The black lines is the same NFW model from Diego et al. (2018a) with concentration of c = 2 and a virial radius of R200 = 3 Mpc. The profiles around the north and south BCG are remarkably similar, suggesting a mass ratio of 1:1 for the two subgroups.
Current usage metrics show cumulative count of Article Views (full-text article views including HTML views, PDF and ePub downloads, according to the available data) and Abstracts Views on Vision4Press platform.
Data correspond to usage on the plateform after 2015. The current usage metrics is available 48-96 hours after online publication and is updated daily on week days.
Initial download of the metrics may take a while.