Open Access
Fig. 4.
Download original image
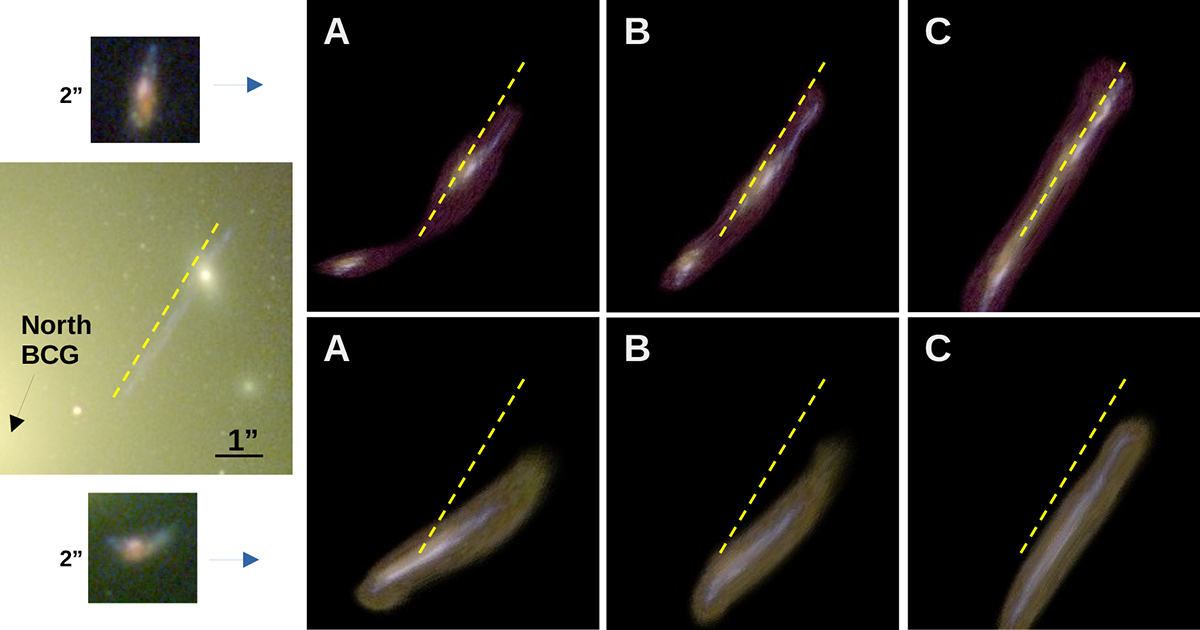
Predicted radial arc 7b near the North BCG for models A, B, and C, and for two different counterimages used as templates. The dashed yellow line is identical in all panels and can be used to compare with the position and orientation of the observed arc.
Current usage metrics show cumulative count of Article Views (full-text article views including HTML views, PDF and ePub downloads, according to the available data) and Abstracts Views on Vision4Press platform.
Data correspond to usage on the plateform after 2015. The current usage metrics is available 48-96 hours after online publication and is updated daily on week days.
Initial download of the metrics may take a while.