Fig. 5.
Download original image
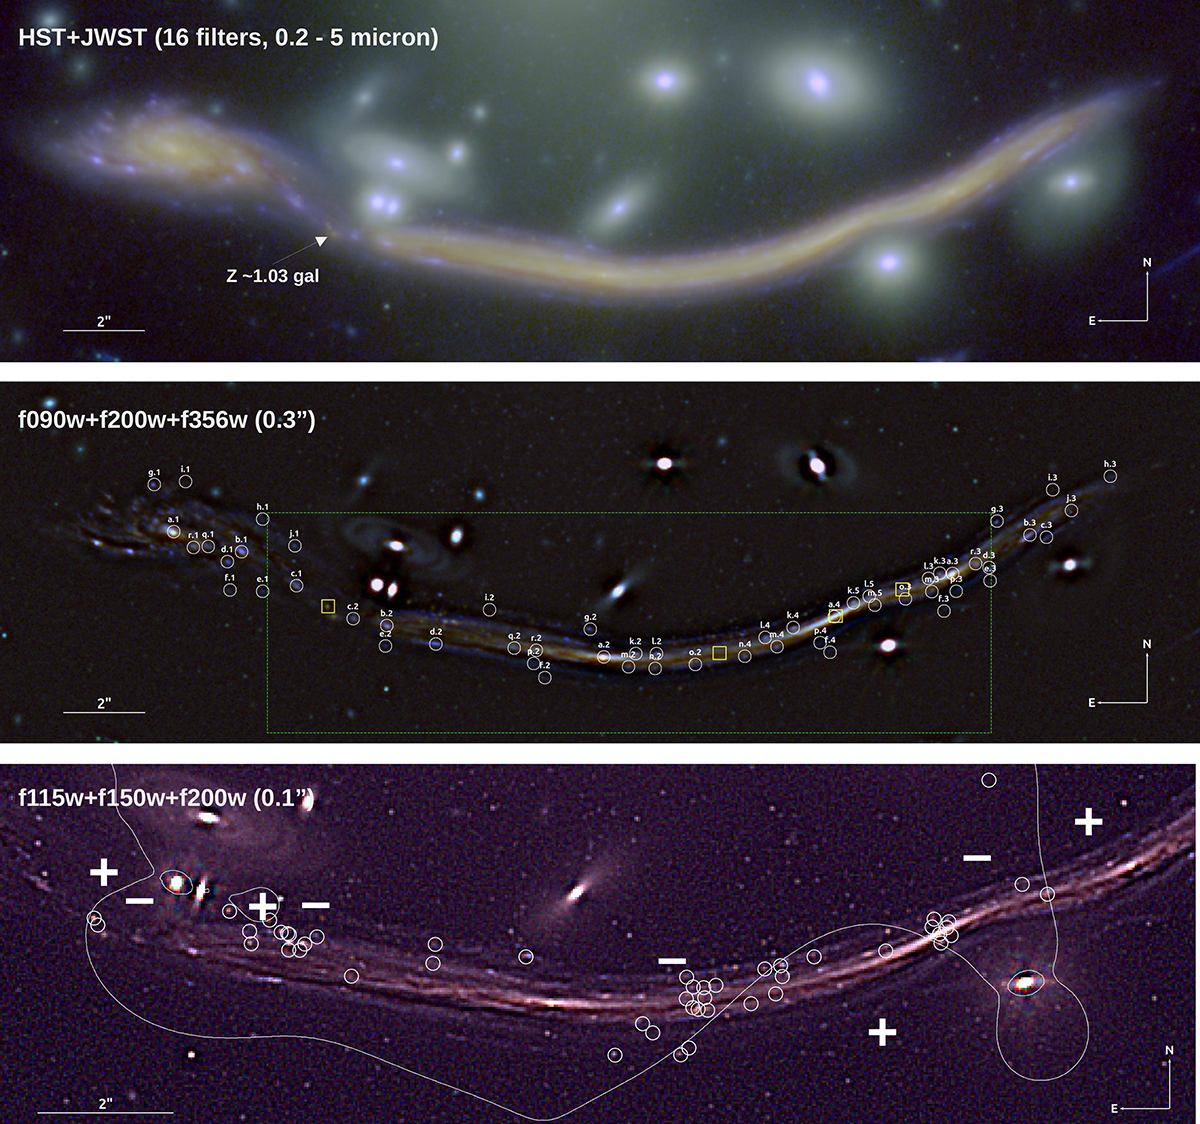
Top: Composite HST+JWST image showing the Dragon arc region. The image is a made form 16 filters with the blue containing HST’s F200LP, F435W, F606W and F814W, green with JWST’s F090W, F115W, F150W, F182M, F200W, and F210M, and red with F277W, F300M, F335M, F356W, F460M, and F480M. Middle, high-pass filtered color version (scale of 0.3 arcsec for the high pass Gaussian filter) of the three filters indicated in the top-left corner. The circles mark the constraints in the Dragon used to derive the lens model. Yellow squares mark the position of the critical points also used as constraints. Bottom: High-pass filtered (scale 0.1 arcsec for the high pass Gaussian filter) color version of the three bands indicated in the top-left corner. The portion of the Dragon shown in this image is marked with a rectangle in the middle panel. Circles indicate the position of the transients in Fudamoto et al. (2025). The white curve is the hybrid WSLAP+ lens model derived with critical points as constraints. The “+” and “−” symbols indicate the parity of the counterimages formed on that side of the CC.
Current usage metrics show cumulative count of Article Views (full-text article views including HTML views, PDF and ePub downloads, according to the available data) and Abstracts Views on Vision4Press platform.
Data correspond to usage on the plateform after 2015. The current usage metrics is available 48-96 hours after online publication and is updated daily on week days.
Initial download of the metrics may take a while.