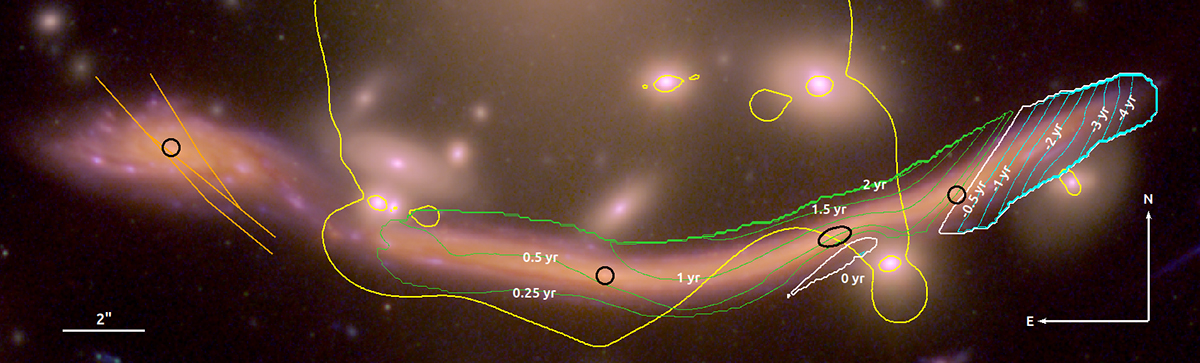
Fig. 8.
Download original image
Time delay along the Dragon arc. Contours show the isochrones of arrival time in the tail of the Dragon with respect to the corresponding position on the head of the Dragon. Images in the portion of the tail with cyan contours arrive before the images in the head while images in the region with green contours arrive after. The white contour marks images in the tail that arrive at the same time as in the head. The critical curve (yellow) and the nucleus (black circle) are included for reference. The orange lines crossing the head of the Dragon represent the caustics in the source plane remapped into the image plane.
Current usage metrics show cumulative count of Article Views (full-text article views including HTML views, PDF and ePub downloads, according to the available data) and Abstracts Views on Vision4Press platform.
Data correspond to usage on the plateform after 2015. The current usage metrics is available 48-96 hours after online publication and is updated daily on week days.
Initial download of the metrics may take a while.