Fig. A.1
Download original image
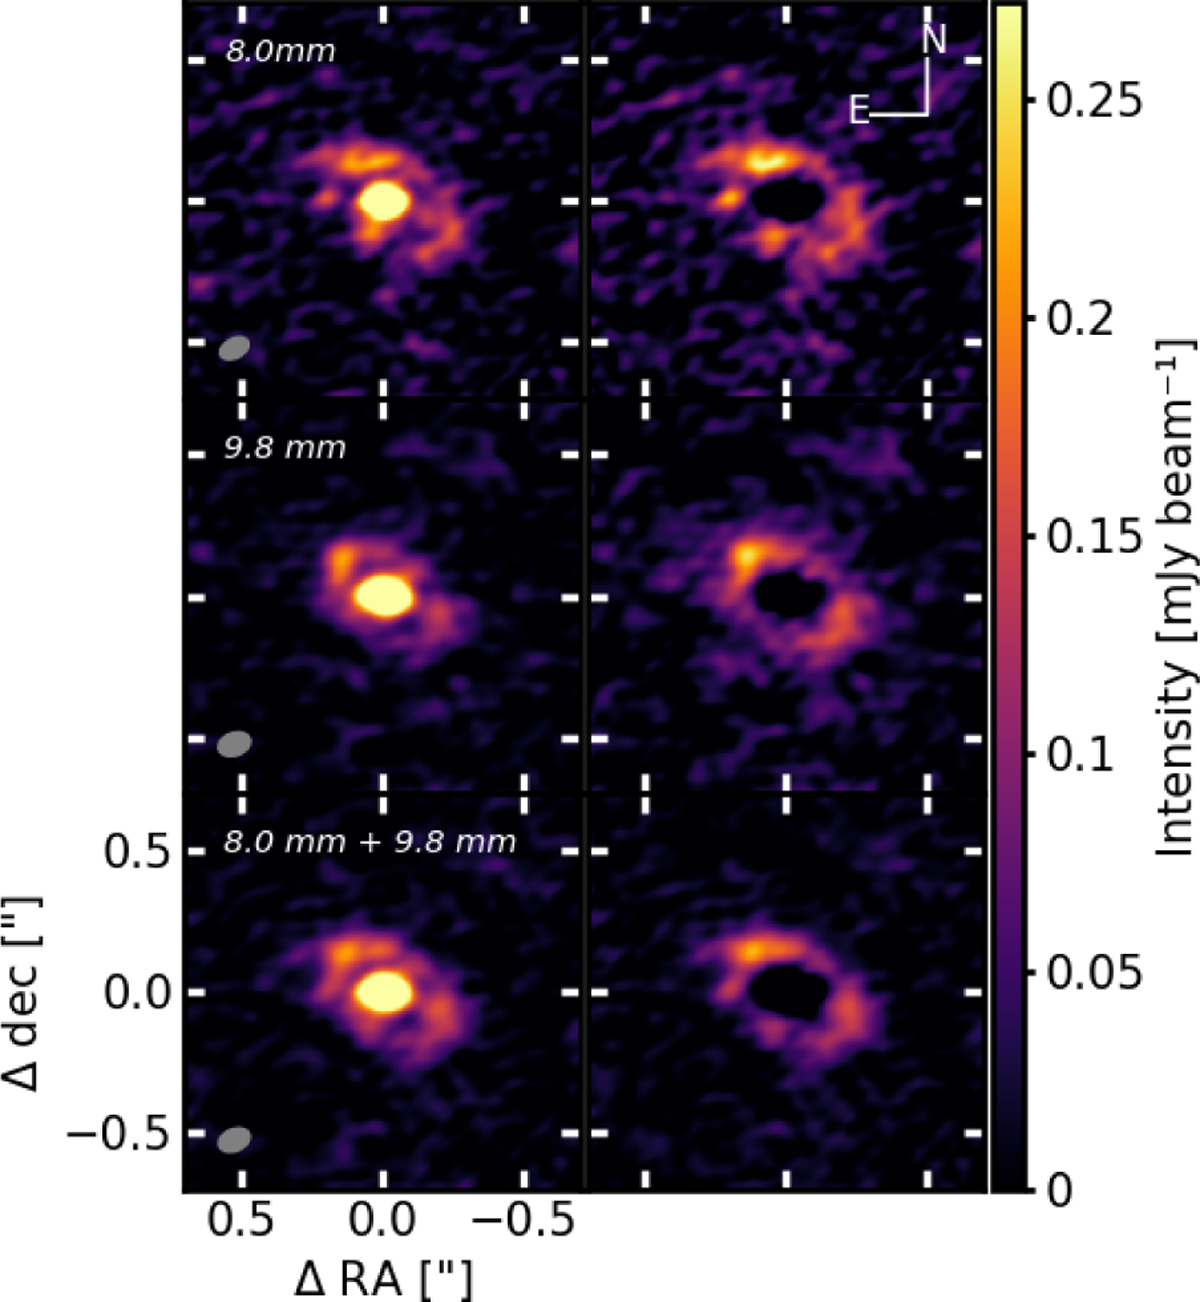
Continuum maps of original VLA datasets (left column) and of VLA datasets where the central binary has been removed (right column). From top to bottom, the images show the data at 8.0 mm, the data at 9.8 mm, and the combination of both datasets. The size of the synthesised beam, which is the same for before and after the binary model subtraction, is represented by the grey ellipse at the bottom left of each original image. Orientation of the sky plane is indicated in the top right panel.
Current usage metrics show cumulative count of Article Views (full-text article views including HTML views, PDF and ePub downloads, according to the available data) and Abstracts Views on Vision4Press platform.
Data correspond to usage on the plateform after 2015. The current usage metrics is available 48-96 hours after online publication and is updated daily on week days.
Initial download of the metrics may take a while.