Fig. B.1
Download original image
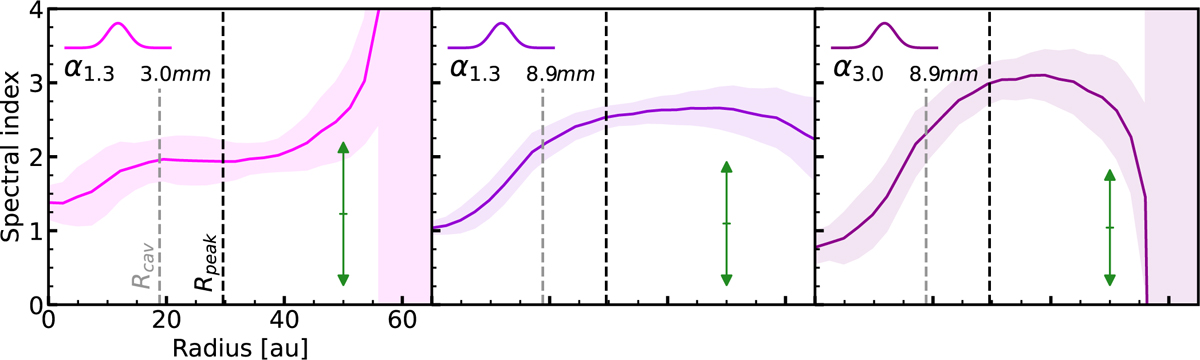
Spectral-index-radial profiles calculated following Equation 2 between 1.3 mm and 3.0 mm (left panel), between 1.3 mm and 8.9 mm (middle panel), and between 3.0 mm and 8.9 mm (right panel). The shaded area correspond to the error, computed from the 1σ standard deviation of the intensity at each radius. The Gaussian inset indicates the geometric average of the beam size, knowing that all the observations have been convolved to a common resolution of 0.12″ × 0.12″. The green arrow in each panel represents the maximum shift possibly introduced by flux calibration systematic errors, which applies equally at each radius. Grey and black vertical-dashed lines correspond respectively to the cavity radius Rcav and peak intensity radius Rpeak at 1.3 mm. Beyond 56 au, negative values in the 3.0 mm data make the calculations fail.
Current usage metrics show cumulative count of Article Views (full-text article views including HTML views, PDF and ePub downloads, according to the available data) and Abstracts Views on Vision4Press platform.
Data correspond to usage on the plateform after 2015. The current usage metrics is available 48-96 hours after online publication and is updated daily on week days.
Initial download of the metrics may take a while.