Fig. C.1
Download original image
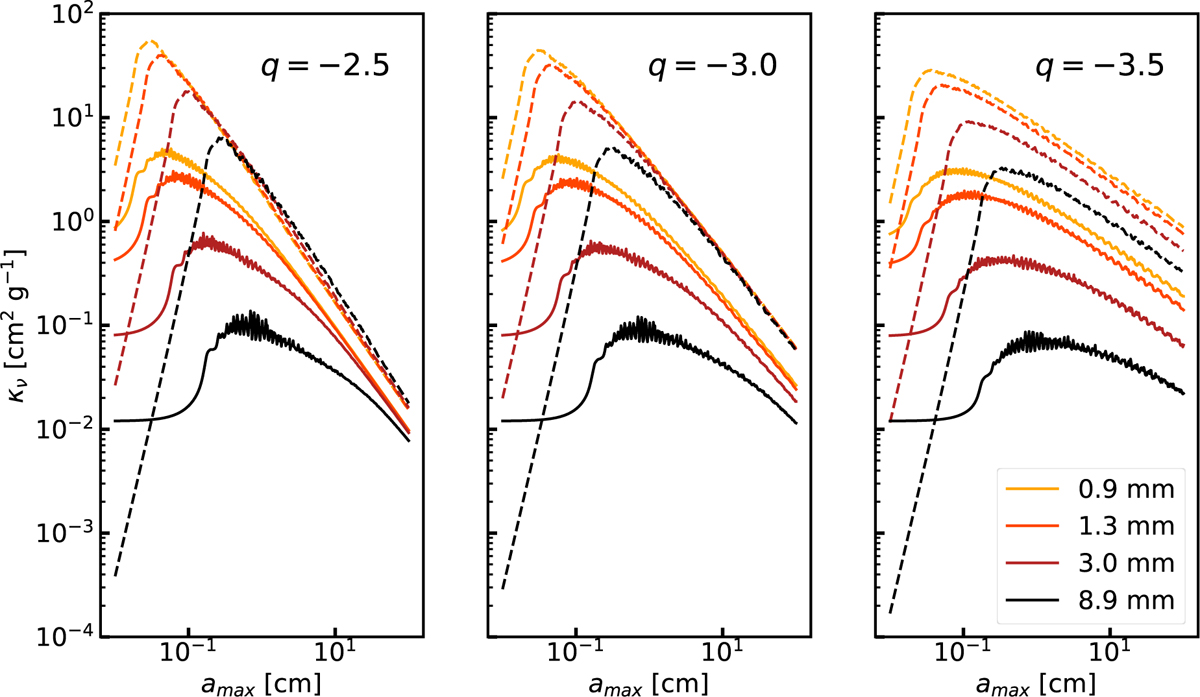
Opacities used in this work at each wavelength as a function of the maximum-grain size. The solid lines indicate the absorption opacities and the dashed lines the scattering opacities, not corrected from the geometrical factor. The left panel displays the opacities for an exponent of the dust-grain-size distribution q = −2.5, the middle panel for q = −3.0, and the right panel for q = −3.5. The opacities were computed using the DSHARP composition and using the DSHARP_OPAC python package (Birnstiel et al. 2018).
Current usage metrics show cumulative count of Article Views (full-text article views including HTML views, PDF and ePub downloads, according to the available data) and Abstracts Views on Vision4Press platform.
Data correspond to usage on the plateform after 2015. The current usage metrics is available 48-96 hours after online publication and is updated daily on week days.
Initial download of the metrics may take a while.