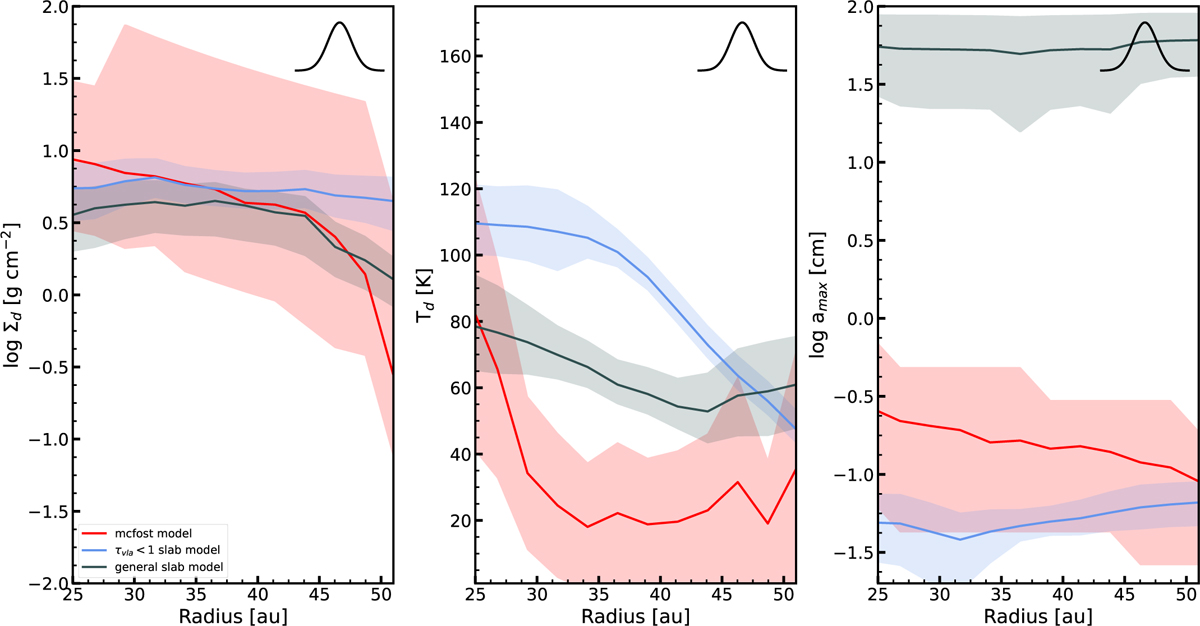
Fig. E.1
Download original image
Marginalised probability distribution resulting from the fitting of radiative-transfer models to the data-radial profiles. The red curve corresponds to the expectation of the MCFOST computed with Equation 7, the blue curve to the one of the dust slab model including an optically thin prior at 8.9 mm, and the grey curve to the one dust slab model without the optical depth prior. The shaded area corresponds to the errors, taken as 1σ confidence interval for the MCFOST models, and delimited by the 16th and 84th percentiles for the slab models. The inset at the top right of each panel represents the synthesised beam of the observations.
Current usage metrics show cumulative count of Article Views (full-text article views including HTML views, PDF and ePub downloads, according to the available data) and Abstracts Views on Vision4Press platform.
Data correspond to usage on the plateform after 2015. The current usage metrics is available 48-96 hours after online publication and is updated daily on week days.
Initial download of the metrics may take a while.