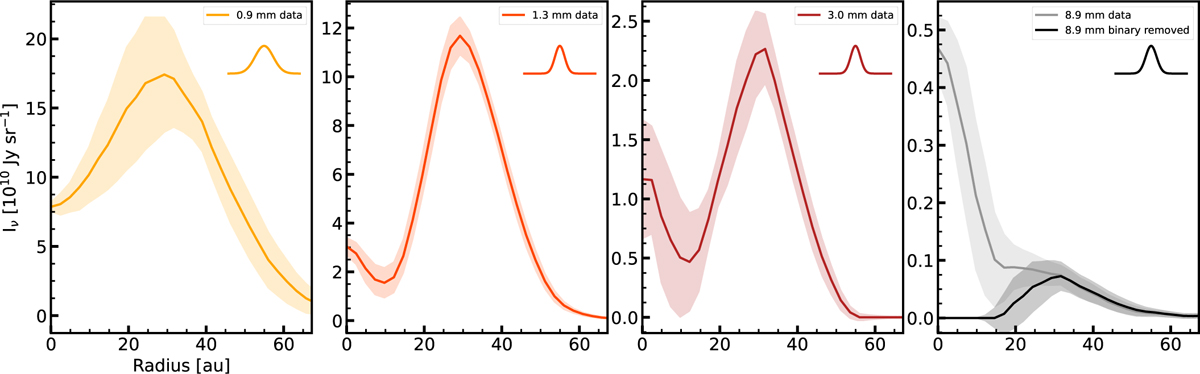
Fig. 2
Download original image
Deprojected radial profiles computed from images shown in Figure 1 at 0.9 mm, 1.3 mm, 3.0 mm, respectively, and combined observations of effective wavelength 8.9 mm from left to right. The shaded area in each panel indicates the uncertainty computed following Equation (1). At 8.9 mm, the radial profile of the binary-subtracted image is also shown. The average geometrical size of the beam is plotted in the top right of each panel.
Current usage metrics show cumulative count of Article Views (full-text article views including HTML views, PDF and ePub downloads, according to the available data) and Abstracts Views on Vision4Press platform.
Data correspond to usage on the plateform after 2015. The current usage metrics is available 48-96 hours after online publication and is updated daily on week days.
Initial download of the metrics may take a while.