Fig. 3
Download original image
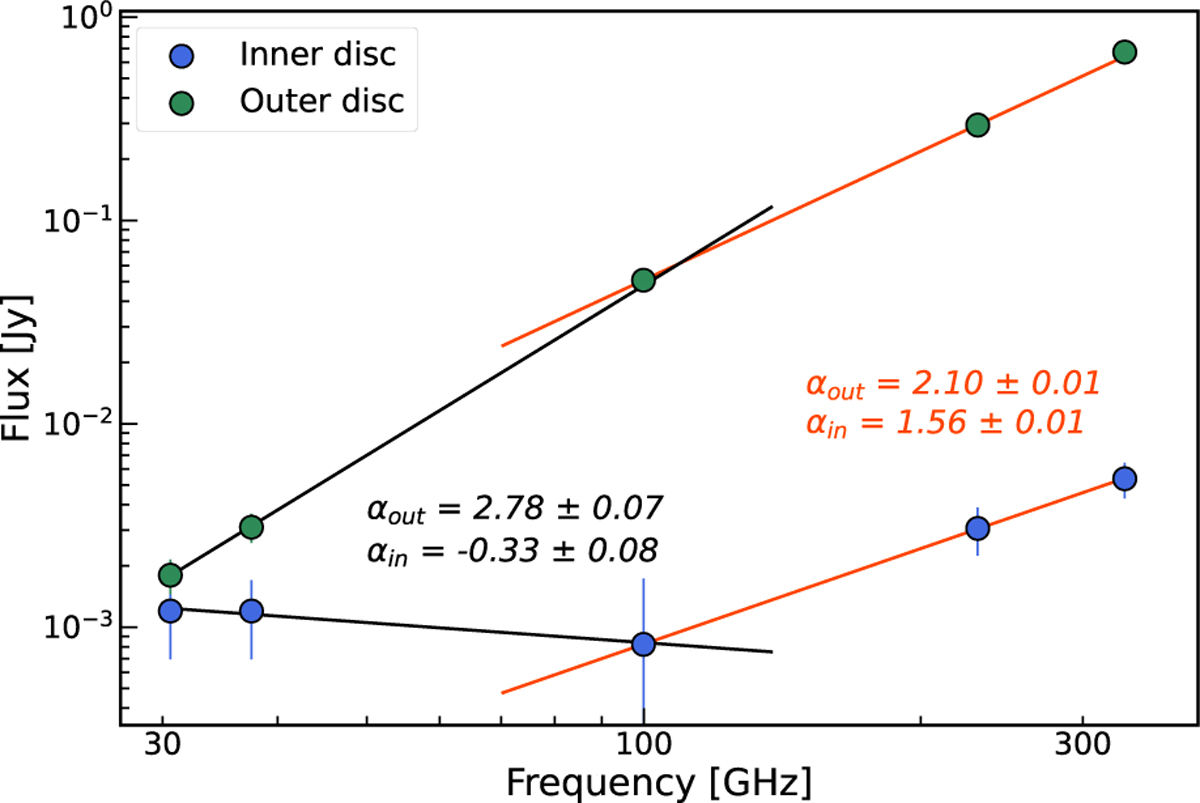
SED of V892 Tau measured from ALMA and VLA observations. The fluxes of the inner and outer discs are represented by the blue and green points, respectively. Our best-fit power-laws and their corresponding spectral index are represented by plain orange lines between 0.9 mm and 3.0 mm (i.e. 100-333 GHz), and in black between 3.0 mm and 9.8 mm (i.e. 30.5-100 GHz). αin and αout are the spectral indices of the inner and outer discs, respectively. The error bars for the outer disc are smaller than the markers at wavelengths shorter than 3.0 mm.
Current usage metrics show cumulative count of Article Views (full-text article views including HTML views, PDF and ePub downloads, according to the available data) and Abstracts Views on Vision4Press platform.
Data correspond to usage on the plateform after 2015. The current usage metrics is available 48-96 hours after online publication and is updated daily on week days.
Initial download of the metrics may take a while.