Fig. 7
Download original image
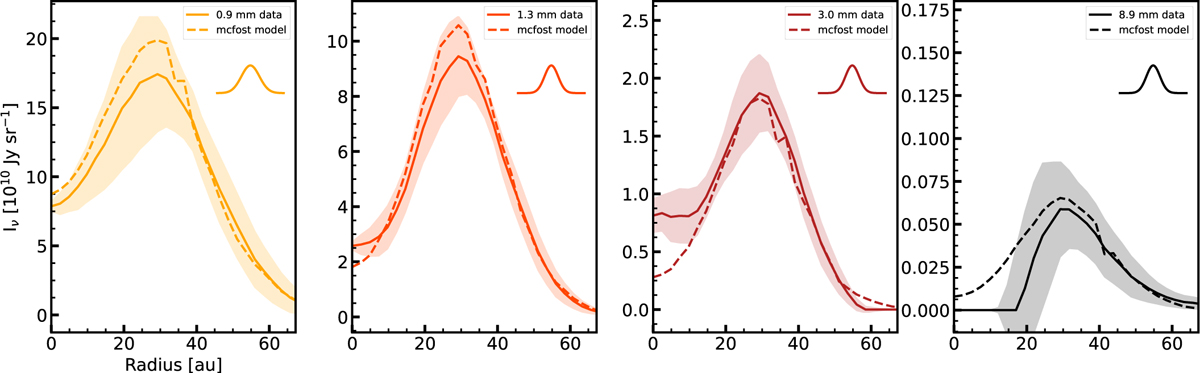
Deprojected, smoothed radial-intensity profiles of data and best-fit model at each wavelength. The data are indicated by plain lines, while the best-fit MCFOST model at each radius is depicted by dashed lines. The shaded area corresponds to the error on the data radial profiles computed following Equation (1). From left to right, the panels show the radial profiles at 0.9 mm, 1.3 mm, 3.0 mm, and 8.9 mm. The 0.9 mm data are shown in their original resolution and were not used in the modelling procedure. The other observations were smoothed to a common resolution of 0.12″ × 0.12″. The geometric mean of the full beam size is represented by the inset curve at the top right of each panel.
Current usage metrics show cumulative count of Article Views (full-text article views including HTML views, PDF and ePub downloads, according to the available data) and Abstracts Views on Vision4Press platform.
Data correspond to usage on the plateform after 2015. The current usage metrics is available 48-96 hours after online publication and is updated daily on week days.
Initial download of the metrics may take a while.