Fig. 10
Download original image
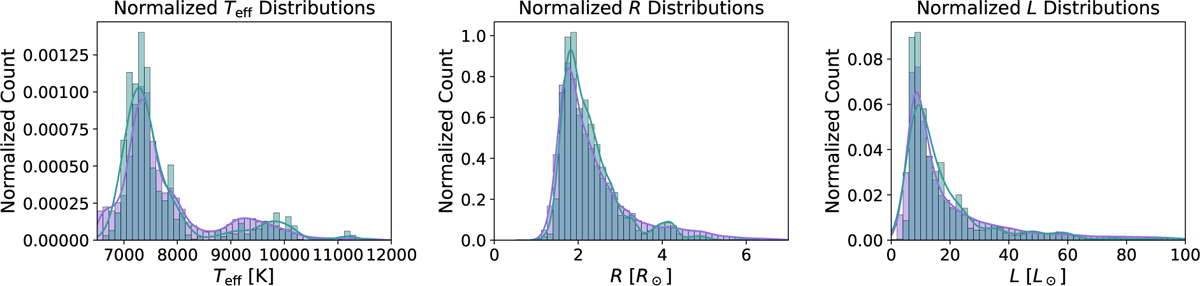
Distribution of fundamental parameters – Teff (left), R (middle), and L (right) – of the final filtered sample of high-probability candidates (purple) and labelled hybrids (teal). Histograms are plotted from 1000 samples for each candidate within the uncertainty range and a Kernel Density Estimator is plotted directly from point estimates of Teff, R, and L.
Current usage metrics show cumulative count of Article Views (full-text article views including HTML views, PDF and ePub downloads, according to the available data) and Abstracts Views on Vision4Press platform.
Data correspond to usage on the plateform after 2015. The current usage metrics is available 48-96 hours after online publication and is updated daily on week days.
Initial download of the metrics may take a while.