Fig. C.1
Download original image
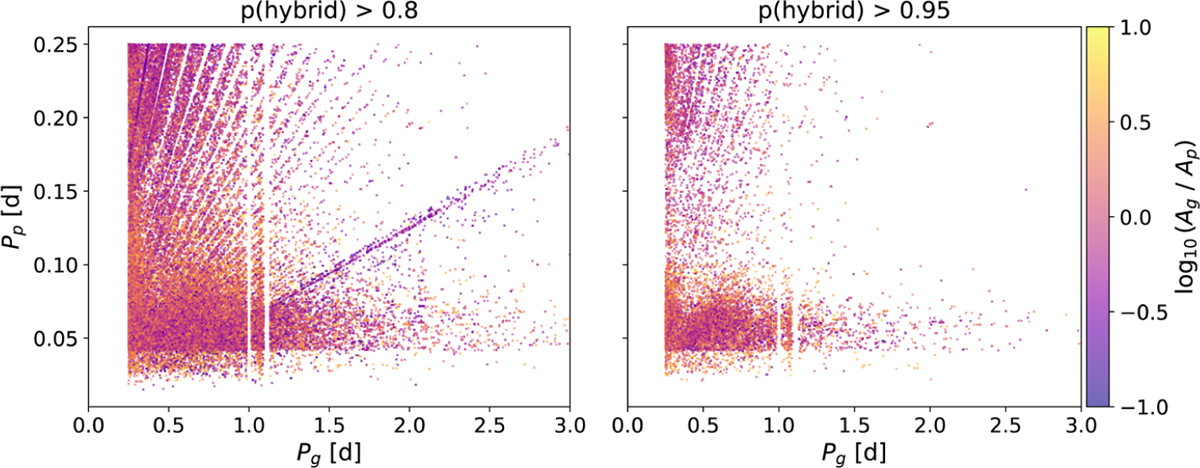
Period-period plot of candidate hybrids with p(hybrid) > 0.8 (left) and p(hybrid) > 0.95 (right) for the inverse of the highest peak detected in frequency regimes <4 d−1 (f𝑔) and >4 d−1 (fp) with a <1% FAP without harmonic avoidance criterion. Note the diagonal lines where Pp is an integer multiple of P𝑔. The colour bar represents lo𝑔10 amplitude ratios of the two periods.
Current usage metrics show cumulative count of Article Views (full-text article views including HTML views, PDF and ePub downloads, according to the available data) and Abstracts Views on Vision4Press platform.
Data correspond to usage on the plateform after 2015. The current usage metrics is available 48-96 hours after online publication and is updated daily on week days.
Initial download of the metrics may take a while.