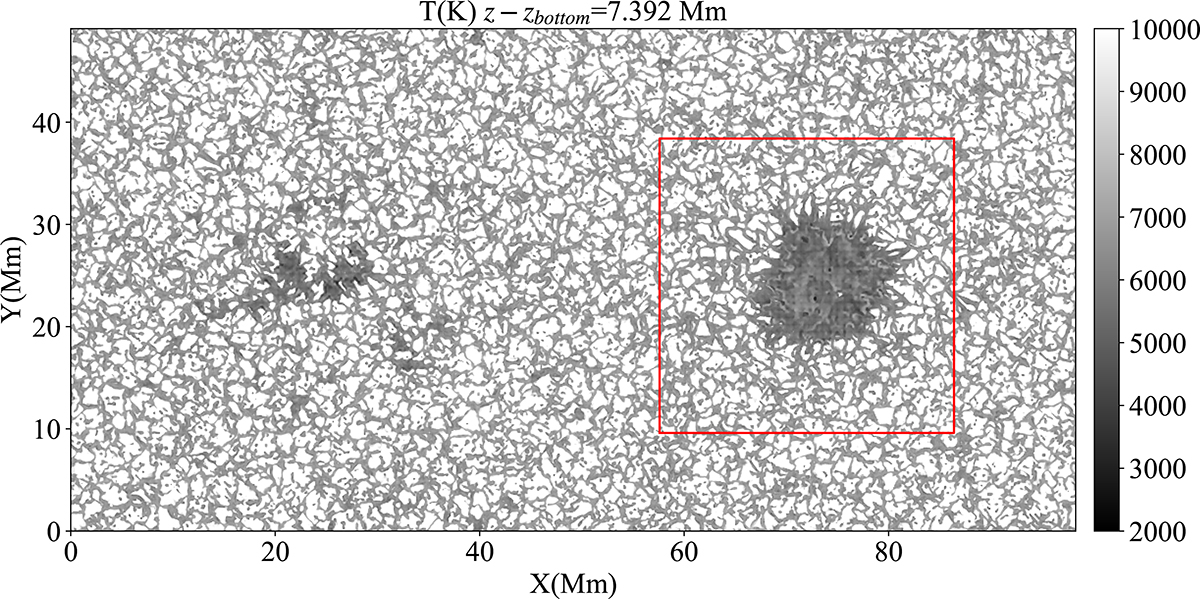
Fig. 1.
Download original image
Temperature at 7.392 Mm above bottom boundary of model, corresponding approximately to log τ500 = 0 in the quiet Sun, where τ500 is the continuum optical depth at λ = 500 nm. The red rectangle delimits the region of interest for the forward synthesis shown in Fig. 2.
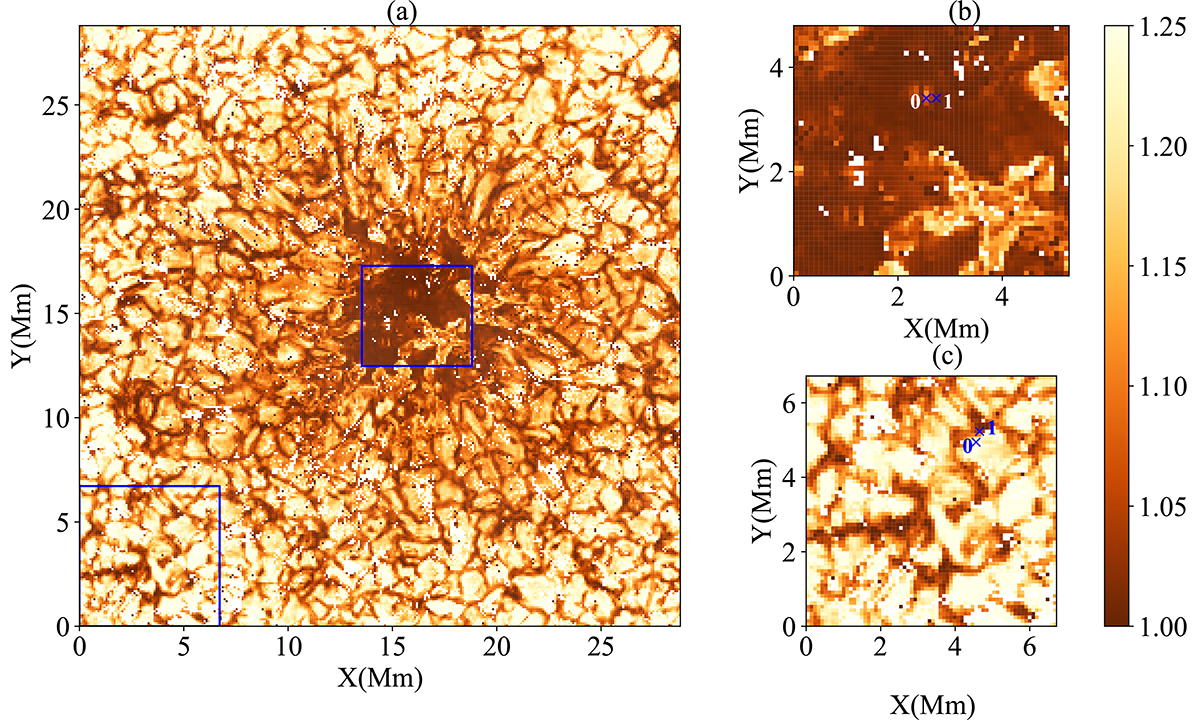
Fig. 2.
Panel (a): Normalized peak intensity of Mg I 12.32 μm line calculated by RH 1.5D for MURaM model. Panel (b): Sunspot umbra. Panel (c): Quiet Sun. The blue crosses in panels b and c mark the pixels used for the analysis in Section 3. Note that the white sprinkles indicate points where the radiative transfer calculation fails to converge or crashes.
Current usage metrics show cumulative count of Article Views (full-text article views including HTML views, PDF and ePub downloads, according to the available data) and Abstracts Views on Vision4Press platform.
Data correspond to usage on the plateform after 2015. The current usage metrics is available 48-96 hours after online publication and is updated daily on week days.
Initial download of the metrics may take a while.