Fig. 3.
Download original image
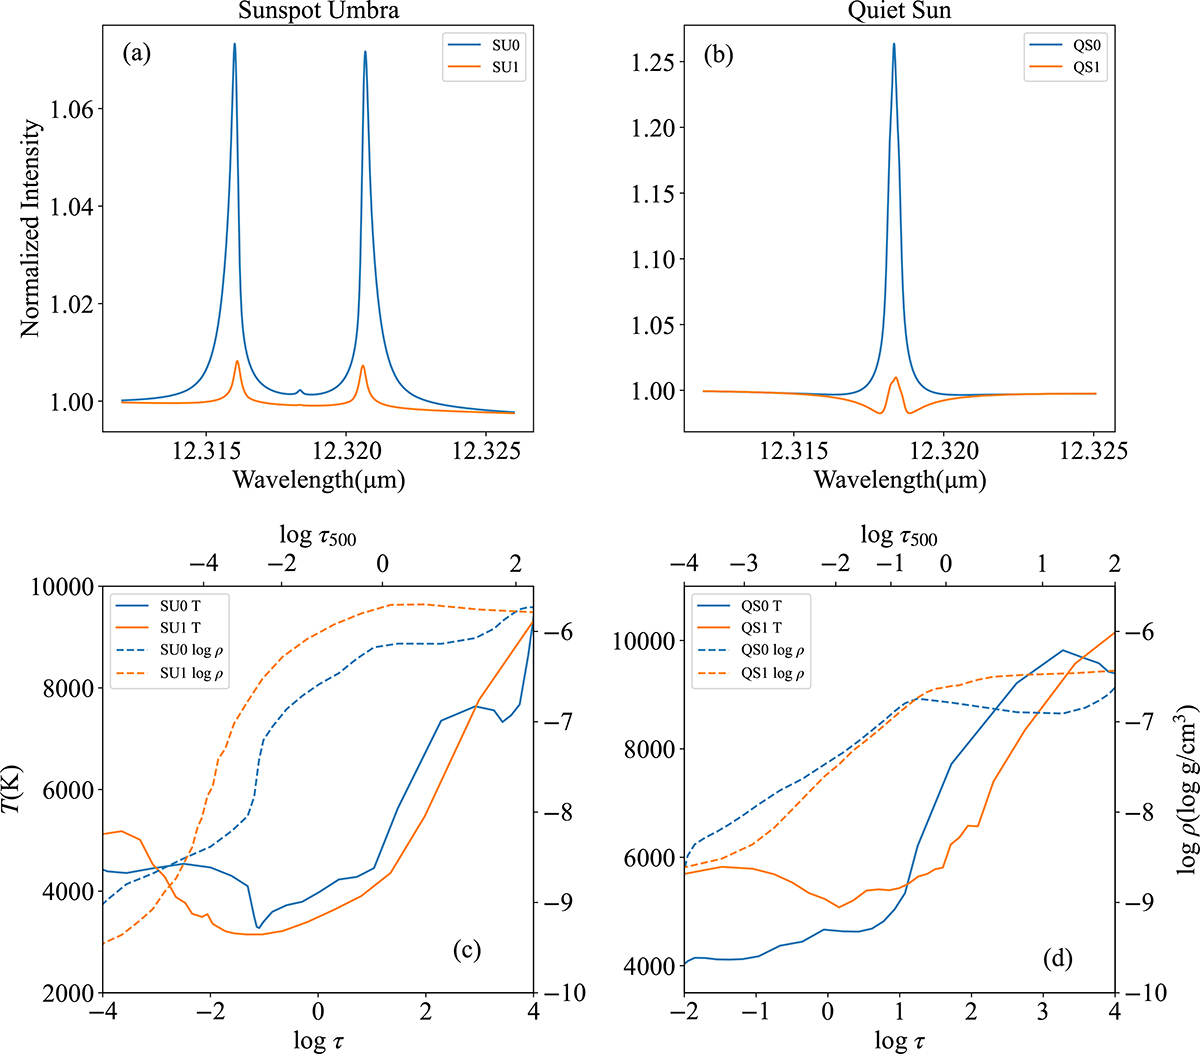
Upper panel: Normalized intensity profiles. Lower panel: Temperature (left y-axis) and density (right y-axis) for the pixels in sunspot umbra (left panel) and quiet Sun (right panel) marked by blue crosses in Fig. 2. SU0: strong emission feature in sunspot umbra; SU1: weak emission feature in sunspot umbra; QS0: strong emission feature in granule; QS1: weak emission feature in intergranular lane. Two optical depth scales are used in the lower panel, where optical depth, τ, scales at the peak wavelength of the Mg I 12.32 μm line intensity (lower x-axis), and τ500 is the continuum optical depth at λ = 500 nm (upper x-axis). Note that the scale of τ500 is uneven.
Current usage metrics show cumulative count of Article Views (full-text article views including HTML views, PDF and ePub downloads, according to the available data) and Abstracts Views on Vision4Press platform.
Data correspond to usage on the plateform after 2015. The current usage metrics is available 48-96 hours after online publication and is updated daily on week days.
Initial download of the metrics may take a while.