Fig. 4.
Download original image
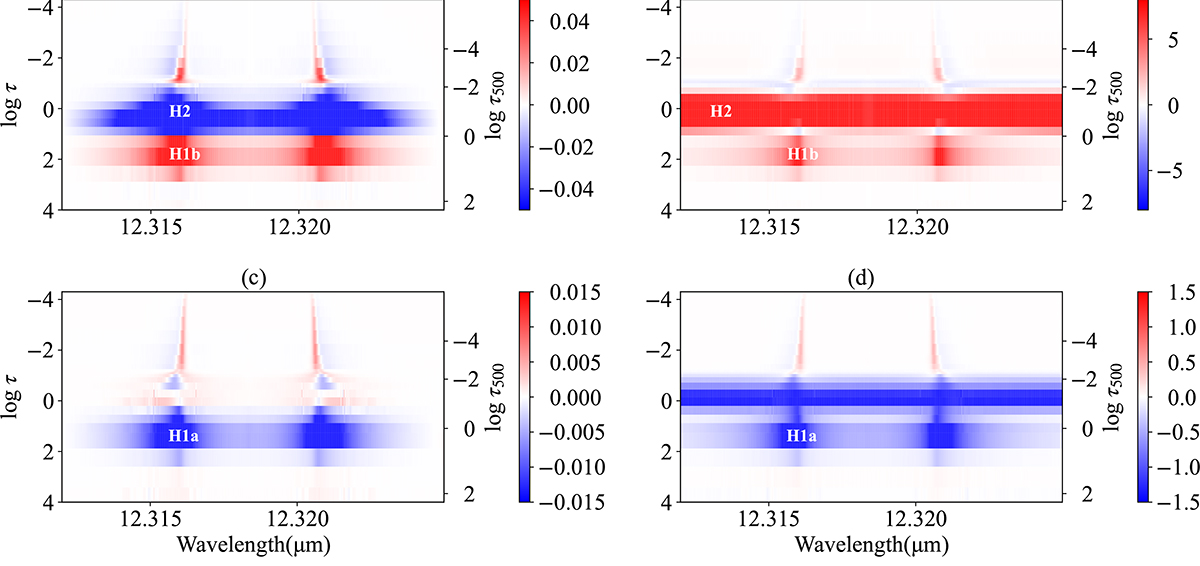
Relative response functions of model SU0. Optical depth, τ, scales at the peak wavelength of the Mg I 12.32 μm line intensity, and τ500 is the continuum optical depth at λ = 500 nm. Note that the scale of τ500 is uneven. Panel (a): Relative response function of normalized intensity to temperature, ![]() . Panel (b): Relative response function of intensity to temperature,
. Panel (b): Relative response function of intensity to temperature, ![]() (10−11 W m−2 Hz−1 sr−1). Panel (c): Relative response function of normalized intensity to density,
(10−11 W m−2 Hz−1 sr−1). Panel (c): Relative response function of normalized intensity to density, ![]() . Panel (d): Relative response function of intensity to density,
. Panel (d): Relative response function of intensity to density, ![]() (10−11 W m−2 Hz−1 sr−1). The relevant definitions are given in Eq. (12).
(10−11 W m−2 Hz−1 sr−1). The relevant definitions are given in Eq. (12).
Current usage metrics show cumulative count of Article Views (full-text article views including HTML views, PDF and ePub downloads, according to the available data) and Abstracts Views on Vision4Press platform.
Data correspond to usage on the plateform after 2015. The current usage metrics is available 48-96 hours after online publication and is updated daily on week days.
Initial download of the metrics may take a while.