Fig. 6.
Download original image
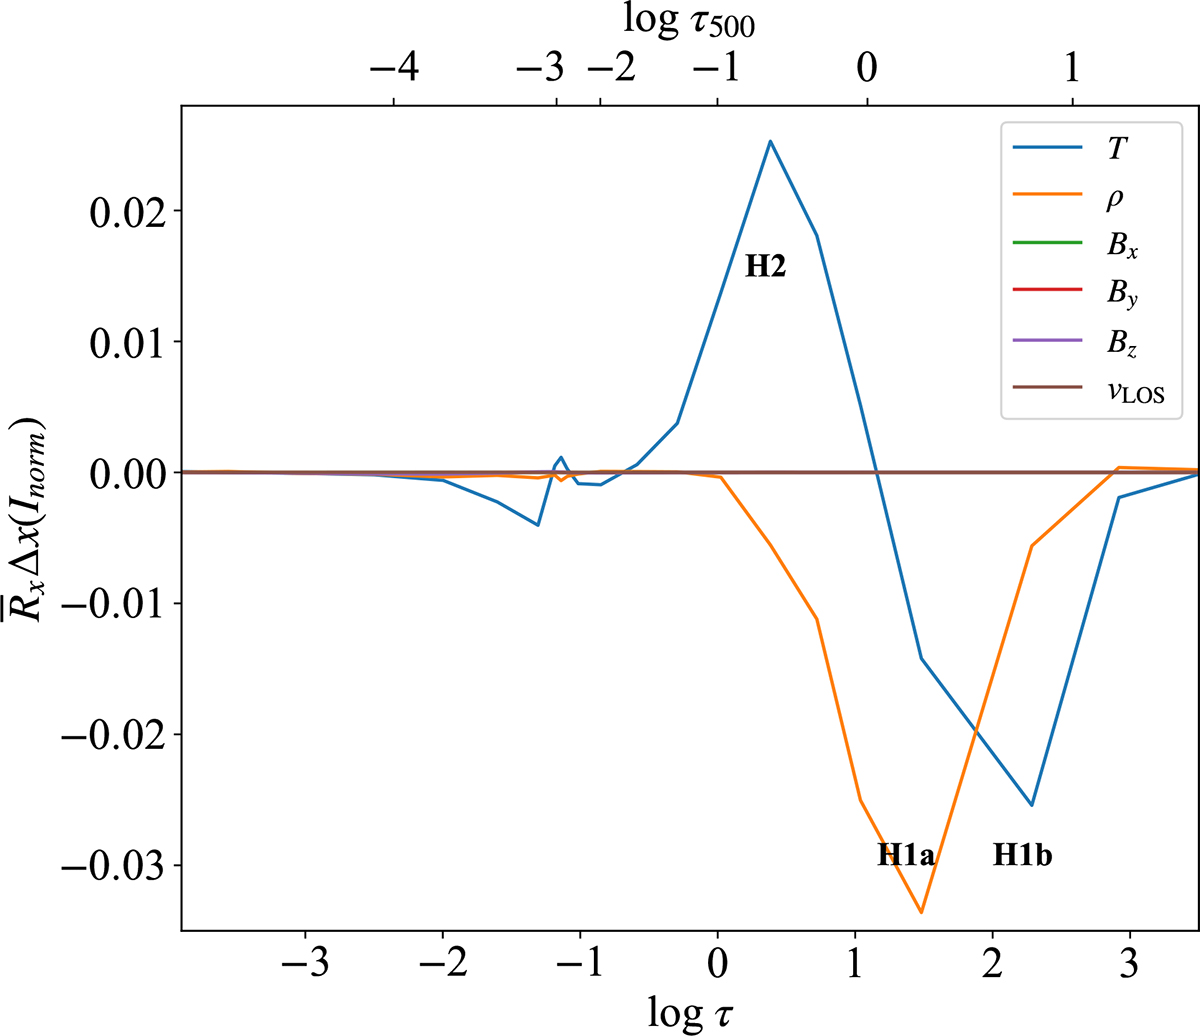
![]() for atmosphere model SU0 and SU1. Different colors represent different physical parameters, i.e., temperature, density, the three magnetic-field components, and the LOS velocity. τ is the optical depth at the peak wavelength of the Mg I 12.32 μm line intensity, and τ500 is the continuum optical depth at λ = 500 nm for model SU0. Note that the scale of τ500 is uneven.
for atmosphere model SU0 and SU1. Different colors represent different physical parameters, i.e., temperature, density, the three magnetic-field components, and the LOS velocity. τ is the optical depth at the peak wavelength of the Mg I 12.32 μm line intensity, and τ500 is the continuum optical depth at λ = 500 nm for model SU0. Note that the scale of τ500 is uneven.
Current usage metrics show cumulative count of Article Views (full-text article views including HTML views, PDF and ePub downloads, according to the available data) and Abstracts Views on Vision4Press platform.
Data correspond to usage on the plateform after 2015. The current usage metrics is available 48-96 hours after online publication and is updated daily on week days.
Initial download of the metrics may take a while.