Fig. 1
Download original image
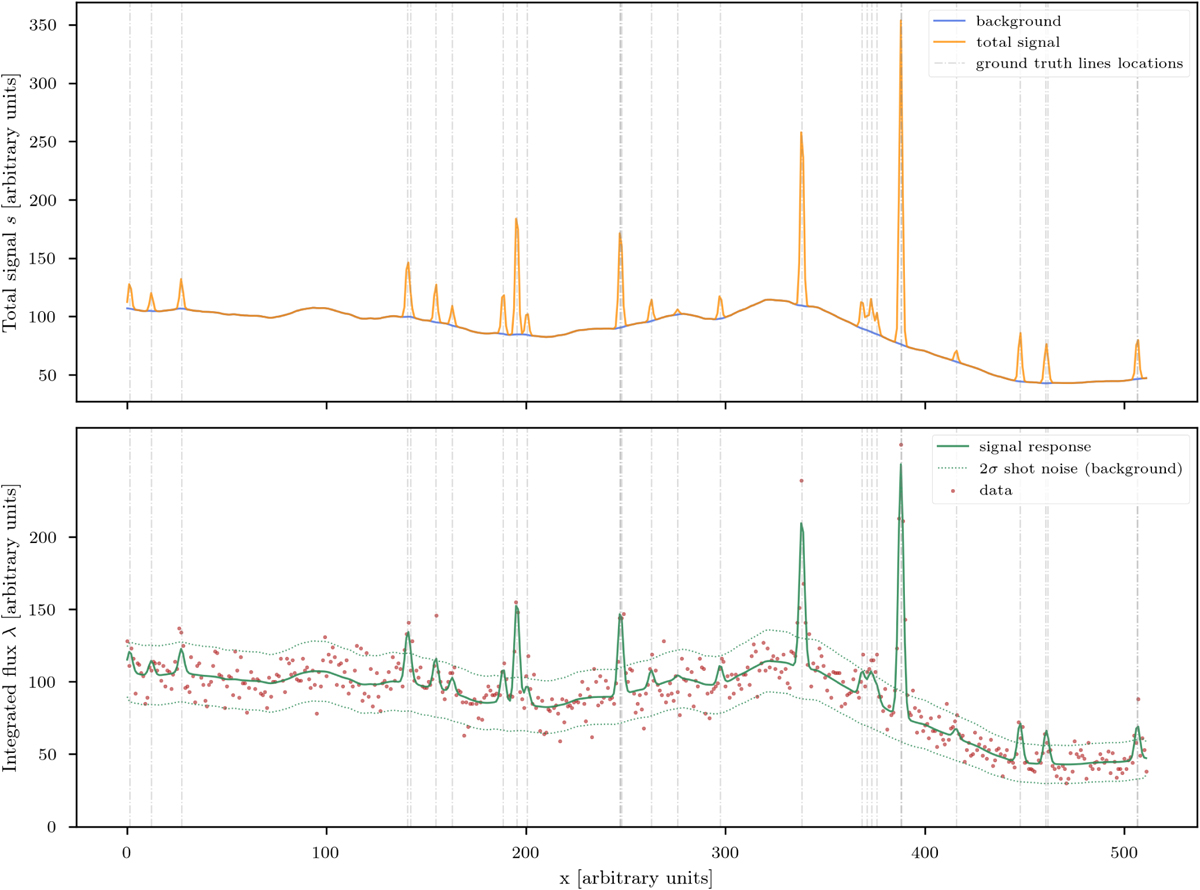
1D example of the automatic component modeling method. The top panel displays the background b (in blue) and the total signal s (in orange) which is the superposition of the background b and the foreground line f signal components. The bottom panel shows the signal response (solid green line), obtained by convolving the total signal s with a Gaussian PSF. Additionally, it displays a synthetic data realization of the signal response (in red), along with the 2σ shot noise level contours associated with the background (dotted green lines). In both panels the vertical dashed-dotted gray lines represent the ground truth line component f locations. We note that a large fraction of the line signal f is buried beneath the background noise level.
Current usage metrics show cumulative count of Article Views (full-text article views including HTML views, PDF and ePub downloads, according to the available data) and Abstracts Views on Vision4Press platform.
Data correspond to usage on the plateform after 2015. The current usage metrics is available 48-96 hours after online publication and is updated daily on week days.
Initial download of the metrics may take a while.