Fig. 10
Download original image
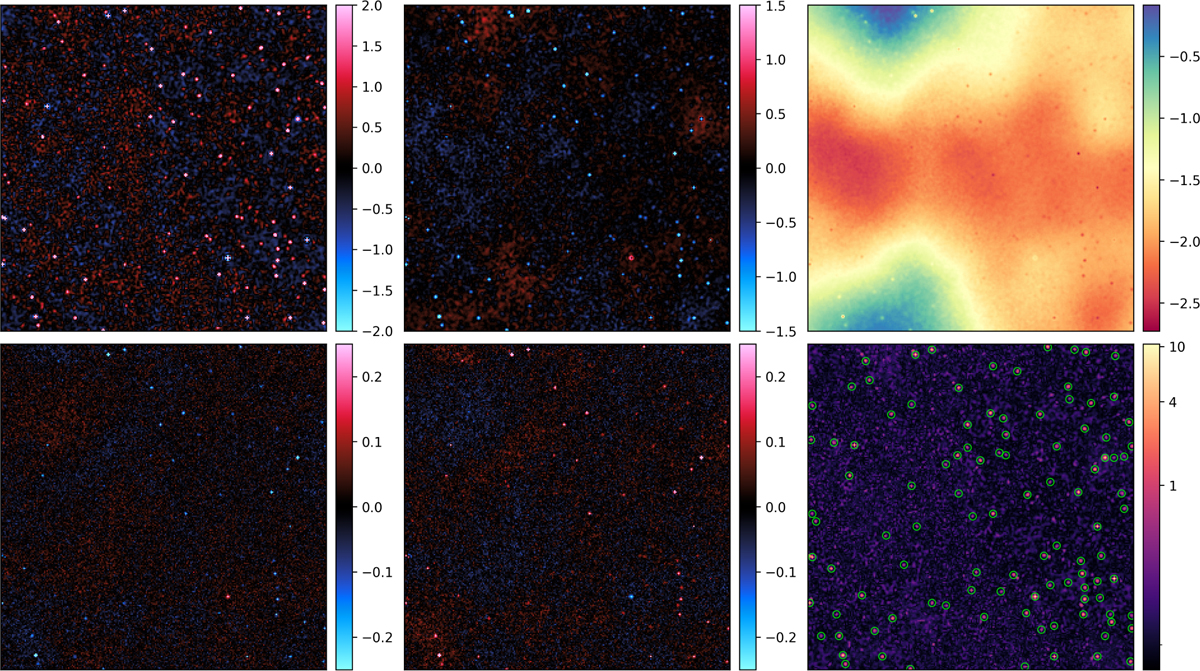
Result of diffuse-only reconstruction. Top row: posterior mean of the spatial excitation field ![]() (left), the spectral-index excitation field
(left), the spectral-index excitation field ![]() (center), and the inferred spectral index field α(x) (right) after reconstructing the sky using only the diffuse component. Bottom row: posterior mean of the spectral deviation excitation field
(center), and the inferred spectral index field α(x) (right) after reconstructing the sky using only the diffuse component. Bottom row: posterior mean of the spectral deviation excitation field ![]() at νlow (left), at νhi (center), and the excitation-norm diagnostic r(x) (right), computed from the displayed excitation fields. Candidate point-source locations identified using the excitation-norm threshold
at νlow (left), at νhi (center), and the excitation-norm diagnostic r(x) (right), computed from the displayed excitation fields. Candidate point-source locations identified using the excitation-norm threshold ![]() are highlighted with lime-colored circles in the r(x) panel.
are highlighted with lime-colored circles in the r(x) panel.
Current usage metrics show cumulative count of Article Views (full-text article views including HTML views, PDF and ePub downloads, according to the available data) and Abstracts Views on Vision4Press platform.
Data correspond to usage on the plateform after 2015. The current usage metrics is available 48-96 hours after online publication and is updated daily on week days.
Initial download of the metrics may take a while.