Fig. 11
Download original image
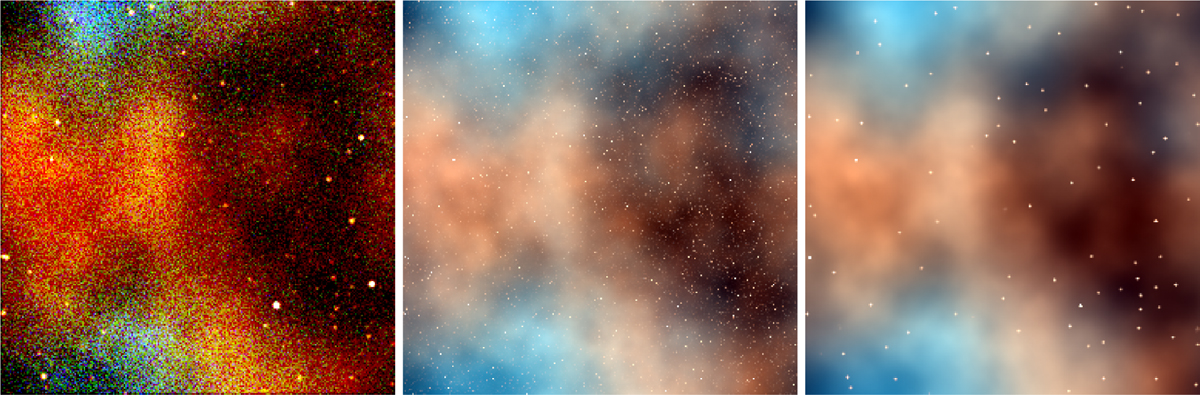
Results of the synthetic multifrequency imaging reconstruction example. Left: exposure-corrected synthetic data. Middle: ground-truth sky emission Right: posterior mean of the reconstructed sky. All images combine the three energy bands into an RGB composite, where red corresponds to the νlow band, green to νref, and blue to νhi.
Current usage metrics show cumulative count of Article Views (full-text article views including HTML views, PDF and ePub downloads, according to the available data) and Abstracts Views on Vision4Press platform.
Data correspond to usage on the plateform after 2015. The current usage metrics is available 48-96 hours after online publication and is updated daily on week days.
Initial download of the metrics may take a while.