Fig. 13
Download original image
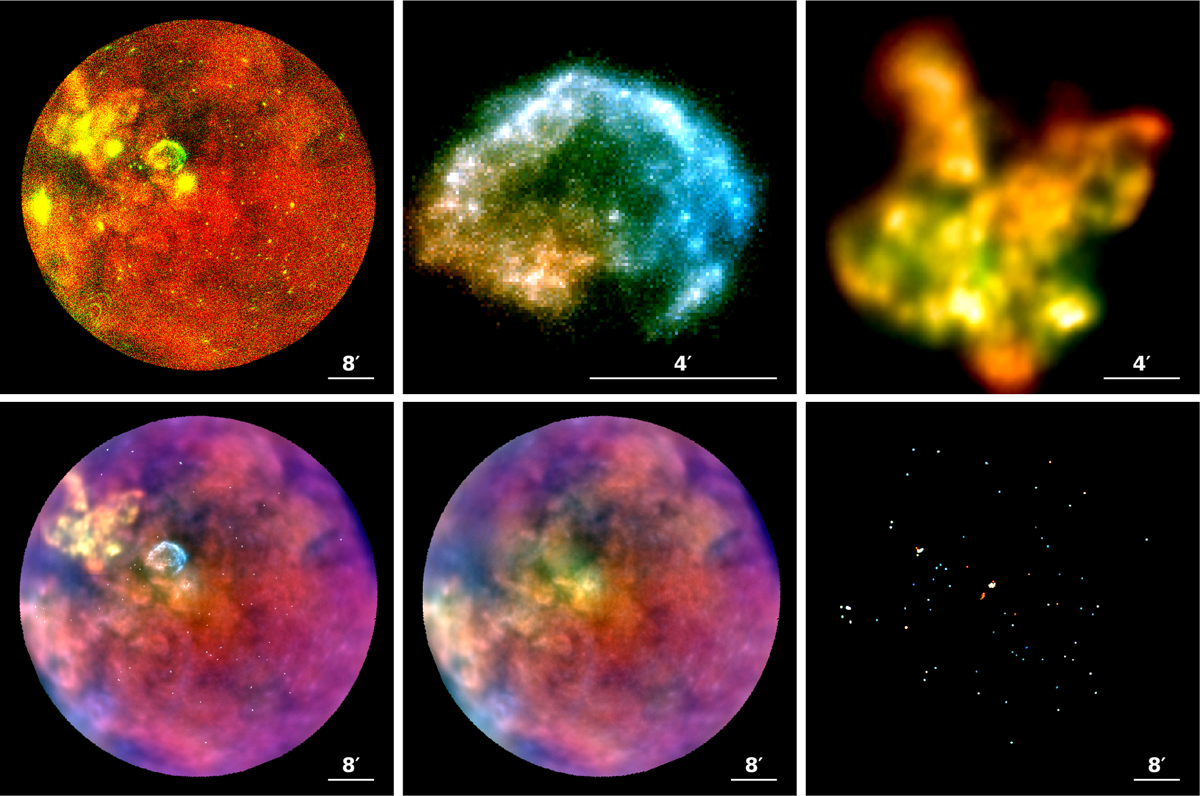
Reconstruction results from the eROSITA early data release (EDR) observation of SN1987A in the LMC. Top row (left to right): exposure- and effective-area-corrected observed data, reconstructed extended emission associated with 30 Doradus C, and reconstructed extended emission from the Tarantula Nebula. Bottom row (left to right): reconstructed total sky signal (including all modeled components), reconstructed diffuse background emission (excluding point and extended sources), and reconstructed point-source emission field. The point source field has been convolved with a Gaussian kernel with a standard deviation of 4″. All panels employ the same RGB color scheme, representing intensities in the three energy bands: red (νlow = 0.2–1.0 keV), green (νref = 1.0–2.0 keV), and blue (νhi = 2.0–4.5 keV).
Current usage metrics show cumulative count of Article Views (full-text article views including HTML views, PDF and ePub downloads, according to the available data) and Abstracts Views on Vision4Press platform.
Data correspond to usage on the plateform after 2015. The current usage metrics is available 48-96 hours after online publication and is updated daily on week days.
Initial download of the metrics may take a while.